- Job Seeker Statistics
- Career Change statistics
- Internship Statistics
- Job Search Statistics
- Average Number Of Jobs Applied
- Average Salary Increase When Changing Jobs
- Part Time Job Statistics
- Age Discrimination Statistics
- Networking Statistics
- Interview Statistics
- Average Number of Jobs In A Lifetime
- Teacher Statistics
- Resume Statistics
Research Summary. Most people agree that teachers are an indispensable part of our society, but while rewarding, the occupation is not without its challenges. Here are some statistics on teachers.
-
There are about 3.2 million public school teachers in the U.S.
-
76% of teachers are female, while just 24% are male.
-
The average student/teacher ratio is 14:3.
-
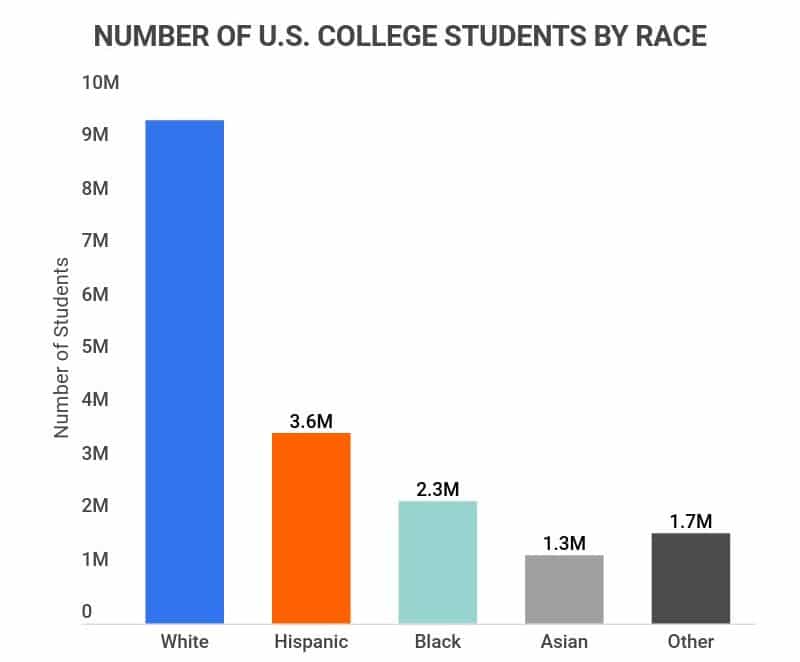
The majority of teachers (79.3%) are white, while 9.3% are Hispanic, 6.7% are Black or African American, and 2.1% are Asian.
-
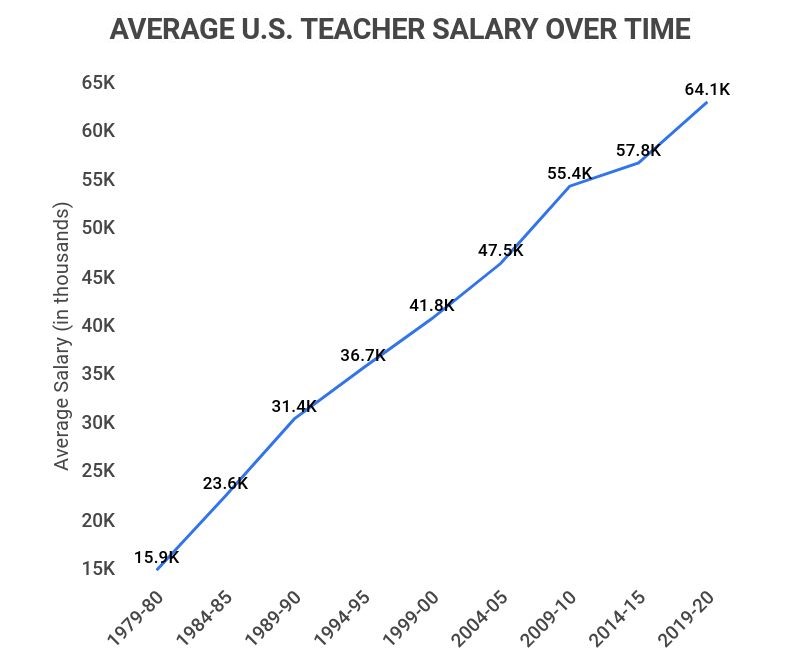
The average U.S. public school teacher’s salary is $65,090.
For further analysis, we broke down the data in the following ways:
Impact | Trends | Demographics | Life
General U.S. Teacher Statistics
-
There are about 3.8 million teachers at both public and private schools in the U.S.
-
There are approximately 130,930 elementary and secondary schools in the U.S.
-
The U.S. has about 13,600 public school districts.
-
During the 2019-2020 school year, there were about 55.5 million students enrolled in pre-K through 12th grade in the U.S.
-
The average salary of an elementary school teacher is $65,420, and the average salary of a high school teacher is $67,340.
-
Teachers in New York have the highest average salaries of any state, and teachers in Mississippi have the lowest average salaries.
U.S. Teacher Statistics by Teachers’ Impact on Students
-
The average teacher will impact more than 3,000 students throughout the course of their career.
-
83% of students say a teacher helped improve their confidence and self-esteem.
-
87% of people wish they’d told their teachers how much they appreciated them.
-
88% of people say their teachers played a significant positive role in their lives.
-
79% of students say they’ve been encouraged to follow their dreams by a teacher.
-
54% of students say they’ve had a teacher who helped them through a difficult time.
-
75% of students say they see teachers as mentors and role models.
U.S. Teacher Trends and Projections
-
If estimates hold true, the U.S.’s demand for teachers will outpace its supply by more than 100,000 by 2025.
This is based on an estimate made in 2016 and doesn’t take into account the COVID-19 pandemic and the burnout it caused, so likely this deficit will be even larger or will be reached earlier than originally thought.
-
The estimated average student/teacher ratio has gone from 15.9 in 2000 to 14.3 in 2019.
This means that in 2000, there were an average of 15 students for every nine teachers in all public and private elementary and secondary schools in the U.S, and in 2019, there were 14 students for every three teachers.
Here is the breakdown of the estimated average student/teacher ratio each year from 2000 to 2019 (note that these are averages, so some values end up at zero):
Year Student/Teacher Ratio 2000 15.9 2001 15.7 2002 15.7 2003 15.7 2004 15.5 2005 15.4 2006 15.3 2007 15.2 2008 15.0 2009 15.3 2010 15.2 2011 15.2 2012 15.1 2013 15.0 2014 14.8 2015 14.7 2016 14.6 2017 14.5 2018 14.4 2019 14.3 -
The job outlook for kindergarten and elementary school teachers from 2020 to 2030 is a 7% growth rate.
Similarly, the job growth rate for high school teachers during that same time period is estimated at 8%. Both of these are right on track with the average growth rate for all occupations in the U.S., which is 8%.
From 2020 to 2030, it’s estimated that there will be an average of 124,300 job openings for kindergarten and elementary school teachers each year and 77,400 for high school teachers. These openings won’t be the result of more schools opening so much as the result of teachers retiring or transferring to other occupations.
U.S. Teacher Statistics by Demographics
-
The average teacher in the U.S. is 42.4 years old.
The largest share (56.9%) of teachers are those between 30 and 49 years old. Here is the breakdown of U.S. teachers’ ages:
Age Range Percentage of Teachers Under 30 15% 30-49 56.9% 50-54 11.6% 55+ 16.5% -
During the 2019-2020 school year, there were 3.2 million public school teachers in the U.S.
There were an additional 500,000 private school teachers that same school year.
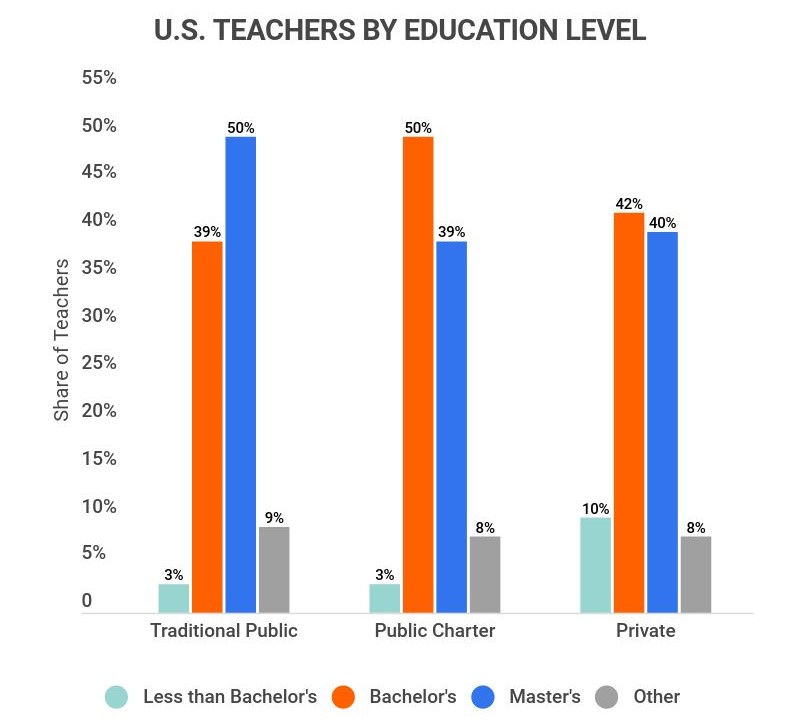
During the 2017-2018 school year, public schools had 3.3 million teachers, public charter schools had 205,600 teachers, and private schools had 509,200.
-
76% of U.S. teachers are female.
This means just 24% are male. In elementary schools, the disparity between male and female teachers is higher, with 89% female and 11% male instructors. In secondary schools, however, the gap narrows, with 64% of secondary teachers being female and 36% being male.

-
79.3% of U.S. teachers are white.
Here is the breakdown of the distribution of U.S. teachers across different races/ethnicities:
Race/Ethnicity Percentage of U.S. Teachers White (Non-Hispanic) 79.3% Hispanic (Regardless of Race) 9.3% Black or African American (Non-Hispanic) 6.7% Asian (Non-Hispanic) 2.1% Two or More Races (Non-Hispanic) 1.8% Native American/Alaska Native (Non-Hispanic) 0.5% Native Hawaiian/Pacific Islander (Non-Hispanic) 0.2%
U.S. Teacher Statistics by Life as a Teacher
-
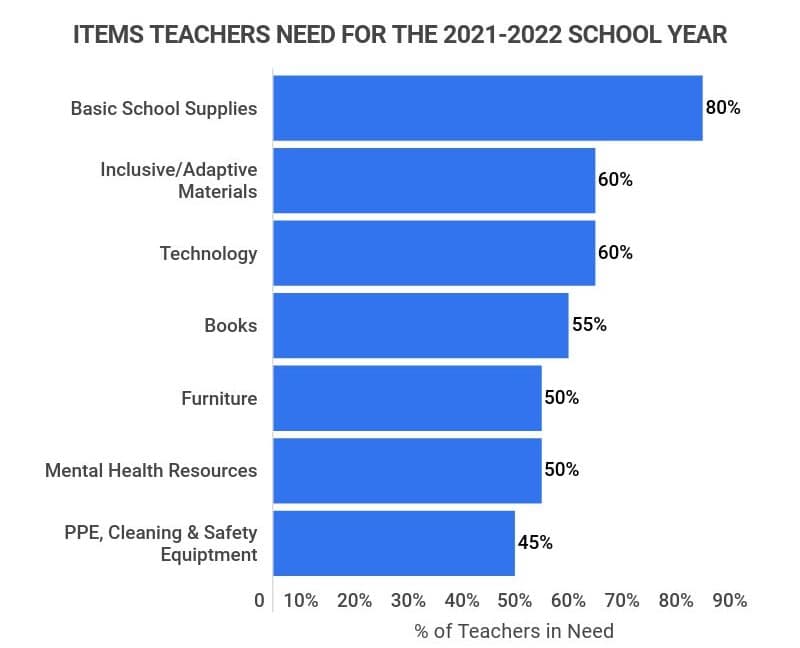
Teachers spend an average of $750 a year on school supplies for their classrooms.
-
On average, teachers work 53.3 hours a week teaching and doing school-related work.
-
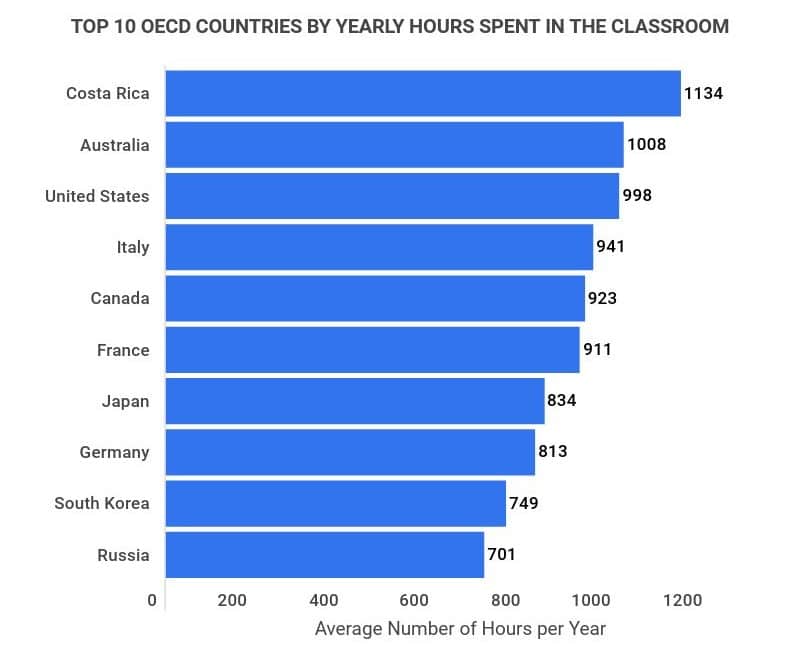
In the U.S., teachers spend an average of 998 hours in the classroom teaching each year.
-
18% of teachers hold second jobs during the school year, which is a far higher percentage than the 4.5% of all U.S. workers who have two jobs.
-
89% of people think teaching is a difficult job.
Teacher Statistics FAQ
-
What percentage of teachers are happy?
About 60% of teachers are happy with their careers. In response to a CareerExplorer survey, teachers rated their happiness with their career at three out of five stars. This may sound pretty middle-of-the-road for career satisfaction, but it actually puts teachers in the bottom 36% of all careers for happiness levels.
While many teachers say they find their work fulfilling and are generally happy with their work environments, many are dissatisfied with their salaries. With only 28% saying they rated their pay at either four or five out of five stars.
The average U.S. public school teacher’s salary is $65,090, while the average salary across all occupations for people with a bachelor’s degree is $67,860. As a significant number of teachers have at least a bachelor’s degree, this means they often earn less than what their similarly educated peers are earning.
-
How much impact do teachers have on students?
Teachers have a significant impact on students. It’s estimated that over the course of their career, a single teacher will impact an average of 3,000 students, whether that’s by having them in their classroom or through some other form of interaction with them.
Teachers are there to educate students, but they are also an encouraging and safe adult presence for many kids and teenagers. More than half of students say a teacher helped them through a difficult time, and 75% say they see their teachers as mentors and role models.
79% of students say a teacher has encouraged them to follow their dreams, and 88% say teachers have made a significant and positive impact on their lives.
-
Why do teachers quit teaching?
Teachers quit teaching for a variety of reasons, including poor preparation, a lack of support, poor pay, and a desire for a different career. Many teachers leave within the first few years of their careers, and many of these exits are caused by poor preparation.
New teachers who haven’t prepared much or at all are more than twice as likely to leave teaching after a year than those who are prepared. The same goes for teachers who don’t get support from their employers, usually in the form of mentoring or other help with being a new teacher.
Even many of the more experienced teachers often leave because of a lack of support from their administrators, and others say that not being able to collaborate with their coworkers is a driving factor in their exit.
One of the most publicly talked about reasons why teachers quit teaching is because they’re dissatisfied with their compensation, and often for a good reason – they often earn significantly less than their other similarly educated peers do, especially mid-career.
In addition to all these reasons, about 25% of teachers who leave teaching say they’re doing so in order to pursue a better career option, and about 30% say that changes in their personal lives drove their decision to leave.
During the COVID-19 pandemic, many cited burnout or health concerns as reasons for their leaving their jobs as well.
-
What percentage of teachers quit in the first five years?
44% of teachers quit in the first five years. And they don’t just quit their current positions – they often leave teaching altogether. This is a much higher rate than most other occupations in the U.S., including those known for high burnout rates, such as police officers.
While this statistic is alarming, it’s nothing new, as for almost two decades now, experts have estimated that almost half of teachers quit within their first five years on the job. Recently when they were able to fully study this, they found that those old estimates were generally right.
Conclusion
The average teacher will impact over 3,000 students throughout the course of their careers. With 3.8 million teachers in the U.S., that’s a lot of students whose lives will be affected by their interactions with their teachers.
Unfortunately, about half of all teachers leave the profession within the first five years of starting work, as teachers often cite low pay, lack of support, or other personal circumstances as their reason for leaving. By 2025, it’s estimated that U.S.’s demand for teachers will exceed the supply by more than 100,000.
This is plausible as the teaching job market is expected to grow by an average of 7% each year from 2020 to 2030. This rate is technically on pace with the rest of the country, except that the number of new teaching positions is due mostly to the current workforce retiring or changing careers rather than the creation of new jobs.
References
-
Statista. “Average Salary of Classroom Teachers in Public Schools in the U.S. From 1980 to 2021.” Accessed on April 21, 2022.
-
NCES. “Back-to-School Statistics” Accessed on April 21, 2022.
-
NCES. “Educational Institutions.” Accessed on April 21, 2022.
-
CER. “K-12 Facts.” Accessed on April 21, 2022.
-
U.S. News. “High School Teacher Salary.” Accessed on April 21, 2022.
-
Statista. “Estimated Average Salary of Public School Teachers in the United States in 2020-2021, by State.” Accessed on April 21, 2022.
-
We Are Teachers. “12 Powerful Statistics That Prove Why Teachers Matter.” Accessed on April 21, 2022.
-
Learning Policy Institute. “A Coming Crisis in Teaching? Teacher Supply, Demand, and Shortages in the U.S.” Accessed on April 21, 2022.
-
NCES. “Digest of Education Statistics.” Accessed on April 21, 2022.
-
U.S. Bureau of Labor Statistics. “Occupational Outlook Handbook: Kindergarten and Elementary School Teachers.” Accessed on April 21, 2022.
-
U.S. Bureau of Labor Statistics. “Occupational Outlook Handbook: High School Teachers.” Accessed on April 21, 2022.
-
NCES. “National Teacher and Principal Survey: Average and Median Age of Public School Teachers and Percentage Distribution of Teachers by Age Category, Sex, and State: 2017-18.” Accessed on April 21, 2022.
-
NCES. “Teacher Characteristics and Trends.” Accessed on April 21, 2022.
-
NCES. “Characteristics of Public School Teachers.” Accessed on April 21, 2022.
-
NCES. “Data Point: Race and Ethnicity of Public School Teachers and Their Students.” Accessed on April 21, 2022.
-
AdoptAClassroom.org. “How Much Do Teachers Spend on Supplies?” Accessed on April 21, 2022.
-
NCES. “National Teacher and Principal Survey: Number and Percentage of Public School Teachers Who Are Regular Full-Time Teachers and Average Number of Hours Per Week That Regular Full-Time Teachers Spent on Selected Activities During a Typical Full Week, by Selected School Characteristics: 2015–16.” Accessed on April 21, 2022.
-
Statista. “Where Teachers Spend the Most Time in the Classroom.” Accessed on April 21, 2022.
-
Pew Research. “About One-in-Six U.S. Teachers Work Second Jobs – And Not Just in the Summer.” Accessed on April 21, 2022.
-
U.S. Bureau of Labor Statistics. “Labor Force Statistics From the Current Population Survey.” Accessed on April 21, 2022.
-
CareerExplorer. “Teachers Are Below Average When it Comes to Happiness.” Accessed on April 21, 2022.
-
NerdWallet. “Average Salaries in the U.S.: How Do You Compare?” Accessed on April 21, 2022.
-
Learning Policy Institute. “Why Do Teachers Leave?” Accessed on April 21, 2022.
-
Education Week. “5 Things to Know About Today’s Teaching Force.” Accessed on April 21, 2022.
- Job Seeker Statistics
- Career Change statistics
- Internship Statistics
- Job Search Statistics
- Average Number Of Jobs Applied
- Average Salary Increase When Changing Jobs
- Part Time Job Statistics
- Age Discrimination Statistics
- Networking Statistics
- Interview Statistics
- Average Number of Jobs In A Lifetime
- Teacher Statistics
- Resume Statistics
Author
Abby is a writer who is passionate about the power of story. Whether it’s communicating complicated topics in a clear way or helping readers connect with another person or place from the comfort of their couch. Abby attended Oral Roberts University in Tulsa, Oklahoma, where she earned a degree in writing with concentrations in journalism and business.