- HR Statistics
- Average Labor Cost Percent Of Sales
- Average Time to Reach Profitability At A Startup
- Office Space Per Employee
- Recruitment Statistics
- Employee Engagement Statistics
- Work-Life Balance Statistics
- BYOD Statistics
- Paternity Leave Statistics
- Onboarding Statistics
- Average Paid Maternity Leave In Us
- Average Cost Of A Bad Hire
- Employee Theft Statistics
- Paid Family Leave Statistics
- Cost Of Hiring Statistics
- Employee Turnover Statistics
- Average Cost Of Employer Sponsored Health Insurance Statistics
- Sexual Harassment In The Workplace Statistics
- HR Statistics
- PTO Statistics
Research Summary. While the U.S. federal government doesn’t require companies to provide paid vacation to employees, they typically offer between 5 and 15 days of PTO per year. Still, millions of Americans work without any paid vacations or holidays. After extensive research, our data analysis team concluded:
-
10 days is the average PTO in the United States private sector, not including paid holidays and sick days.
- 55% of Americans don’t use all of their paid time off.
-
American workers failed to use 768 million days of PTO in 2018.
-
Americans left an average of 6.5 unused PTO days in 2018 — that works out to 27.2% of PTO days that employers offered.
-
63% of employees said they’d turn down a job offer if it didn’t include PTO.
-
28 million Americans don’t get any paid vacation or paid holidays, as the United States is the only advanced economy in the world that does not guarantee its workers paid vacation days and paid holidays.
For further analysis, we broke down the data in the following ways:
Length | Usage | Reasons | Age | Industry | Location | Illness | Additional
Paid Time Off Statistics by Length
Many factors can impact how much paid time off employees receive, which averages nearly 24 days per year. This number generally increases with company size and employee tenure. On average, employees don’t use 6.5 days of their annual PTO.
-
As much as 31% of employees do not receive paid time off.
-
As crucial as paid time off is for employees, most (74%) would rather earn more money than receive more time off, and over half of them say their time off is adequate.
-
77% of educators said they’d prefer a raise over more PTO.
-
On average, employees earned 23.9 days of PTO (including paid holidays and sick days) in 2018, up from 23.2 days in 2017.
-
For employees who get a lump sum of paid time off, they’re offered an average of 8.8 days.
-
16% of those with PTO report having an unlimited vacation policy.
-
Unlimited vacation policies rose by 178% between 2015-2019, according to a study that examined job postings.
Paid Time Off Statistics by Usage
-
The highest income earners, those earning more than $150,000 annually, took an average of 22.5 days and left only 3.1 days on the table.
-
More than half of Americans (55%) don’t use all of their paid time off.
-
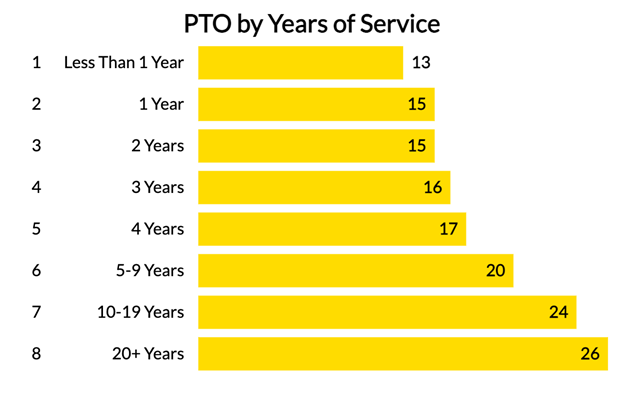
In a typical American small business, employees will earn an extra three to four days of paid time off for every five years of service.
-
52% of employees with PTO say they’ve worked during their time off.
-
The average number of unused PTO days increased to 6.5 days in 2018, up from 6 days in 2017.
-
More than a quarter (27.2%) of PTO went unused in 2018 — up from 25.9% in 2017.
American workers failed to use 768 million days of PTO in 2018 — a 9% increase from 2017.
| PTO by Years of Service | |
|---|---|
| Years of Service | Average Number of PTO Days |
| Less Than 1 Year | 13 |
| 1 Year | 15 |
| 2 Years | 15 |
| 3 Years | 16 |
| 4 Years | 17 |
| 5-9 Years | 20 |
| 10-19 Years | 24 |
| 20+ Years | 26 |
Reasons for Paid Time Off
Most employees use some of their paid time off to help ease their mind, boost mental health, catch up on sleep, and enjoy a staycation. However, they rarely report these reasons to their manager.
-
More than half of employees (54%) with paid time off have used sick time to take a mental health day in the past year, although they don’t report the reason to their boss.
-
1 in 5 employees with paid time off has misled their manager about why they needed time off, a quarter of those who admit to it did so to sleep, and 50% did so because they needed a mental health day.
-
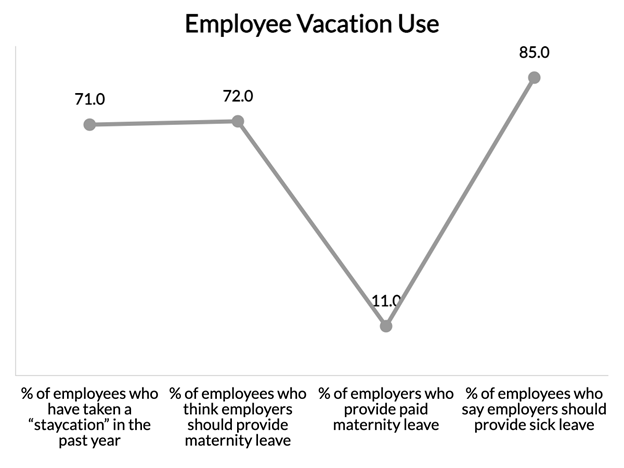
71% of employees have taken a “staycation” in the past year.
-
85% of employees said employers should provide sick leave.
-
72% said employers should provide maternity leave (only 11% of employers offered it).
-
Americans used an average of 9 days of their total paid time off to travel in 2018 — one day more than in 2017.
-
Three-quarters of American workers surveyed say it’s very important employers provide paid vacation time (76%), paid sick time (74%), and paid holidays (74%).
Paid Time Off Statistics by Employee Age
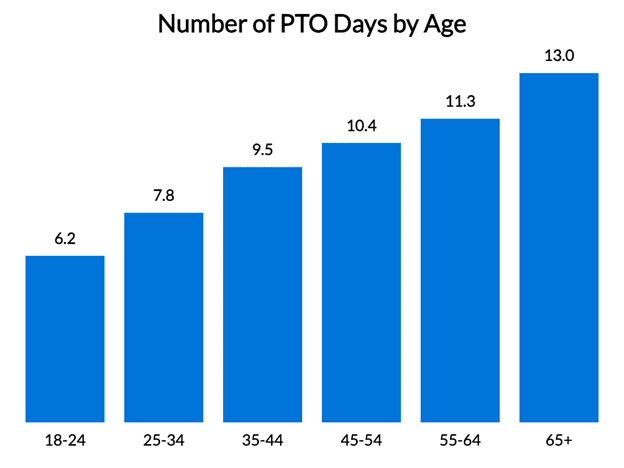
Older generations typically take more paid time off than younger generations. In fact, the youngest demographic receives about half as much PTO as those in the highest age bracket.
-
Around one-third of baby boomers (35%) and Gen X (31%) reported taking 10-19 days in 2018 compared to only one in five Millennials (21%).
-
Americans with older kids tend to take more time off than those with younger kids.
| Number of PTO Days by Age | |
|---|---|
| Age | Average Number of PTO Days |
| 18-24 | 6.2 |
| 25-34 | 7.8 |
| 35-44 | 9.5 |
| 45-54 | 10.4 |
| 55-64 | 11.3 |
| 65+ | 13.0 |
Paid Time Off Statistics by Industry
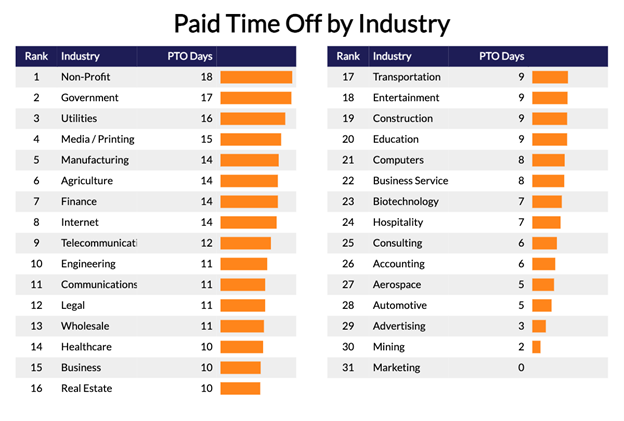
Industry plays a significant role in how much paid time off employees receive. Those who work in professional and technical fields typically have more PTO than employees who work in blue-collar and service professions.
-
76% of private industry workers (who make up 84.7% of all workers) receive paid vacation days.
-
Employees in professional, technical, and related fields with one year of experience receive an average of 10 paid vacation days per year. This number increases to 17.8 days after 25 years.
-
Clerical and sales employees with one year of experience receive an average of 8.6 paid vacation days per year. This number increases to 16.4 days after 25 years.
-
Blue-collar and service employees with one year of experience receive an average of 6.8 paid vacation days per year. This number increases to 14.1 days after 25 years.
-
Many employees in the hotel and food industry — 32% — said they don’t get paid time off. Nearly 60% said they don’t get enough time off, and only 15% say they don’t come to work when they’re sick.
-
Americans employed in the information industry (e.g., tech and media) prefer to use their PTO to travel more than Americans employed in other industries.
-
Workers in finance and insurance took more vacation days and used a greater share of their vacation days to travel.
| Paid Time Off by Industry | |
|---|---|
| Industry | Average Number of PTO Days |
| Non-Profit / Foundation | 17.5 |
| Government / Military | 17.3 |
| Utilities | 15.8 |
| Media / Printing / Publishing / Broadcasting | 14.8 |
| Manufacturing | 14.2 |
| Agriculture / Forestry / Fishing | 14.0 |
| Finance / Banking / Insurance | 14.0 |
| Internet (Including SaaS/Mobile) | 13.7 |
| Telecommunications | 12.3 |
| Engineering / Architecture | 11.4 |
| Communications | 10.9 |
| Legal | 10.9 |
| Wholesale | 10.6 |
| Healthcare / Medical (including Hospice/Homecare/Outpatient) | 10.4 |
| Business / Professional Services | 9.8 |
| Real Estate | 9.7 |
| Transportation / Distribution | 8.7 |
| Entertainment / Recreation | 8.6 |
| Construction / Home Improvement | 8.5 |
| Education | 8.5 |
| Retail | 8.3 |
| Computers (Hardware, Desktop Software) | 7.9 |
| Business Services (Hotels, Lodging Places) | 7.8 |
| Biotechnology | 7.2 |
| Food Service / Hospitality / Travel (including restaurants, hotels, etc.) | 6.9 |
| Consulting | 6.0 |
| Accounting | 5.6 |
| Aerospace / Aviation | 5.3 |
| Automotive (Sales/Repair) | 4.7 |
| Advertising | 3.3 |
| Mining | 2.0 |
| Marketing / Market Research / Public Relations | 0.0 |
Paid Time Off Statistics by Geographic Location
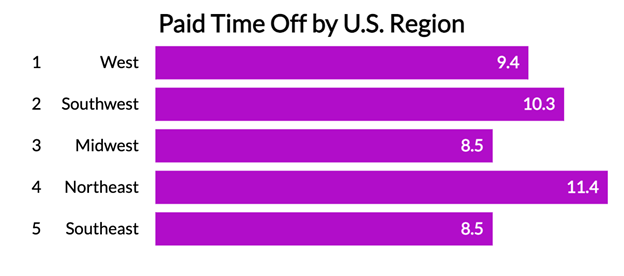
The state and region in which you work can have a meaningful impact on the number of paid time off days you have, as well as the percentage of the population that works without PTO.
-
Workers in the Midwest took the most vacation days and used a greater share of their vacation days for travel.
-
A QuickBooks Time study in Canada involving 500 employees found Canadian employers typically offer 10 days of PTO per year.
-
This same study found that Australian employers typically offer employees between 16 and 20 days of PTO per year.
-
Although US employees are less likely to receive PTO than their Canadian or Australian counterparts, 74% of U.S. workers would take a raise over more PTO.
-
Comparatively, 14% of Australian workers and just 8% of Canadian workers say they receive no PTO.
| Paid Time Off by U.S. Region | ||
|---|---|---|
| Region | States | Average PTO Days |
| West | California, Nevada, Utah, Idaho, Montana, Wyoming, Colorado | 9.4 |
| Southwest | Arizona, New Mexico, Texas, Oklahoma | 10.3 |
| Midwest | Kansas, Nebraska, South Dakota, North Dakota, Missouri, Iowa, Minnesota, Michigan, Illinois, Ohio, Wisconsin, Indiana | 8.5 |
| Northeast | Maine, New York, Massachusetts, Rhode Island, New Hampshire, Vermont, Connecticut, Delaware, New Jersey, Pennsylvania | 11.4 |
| Southeast | West Virginia, DC, Carolinas, Virginia, Tennessee, Arkansas, Louisiana, Alabama, Florida, Georgia, Kentucky, Maryland | 8.5 |
PTO Statistics Related to Illness
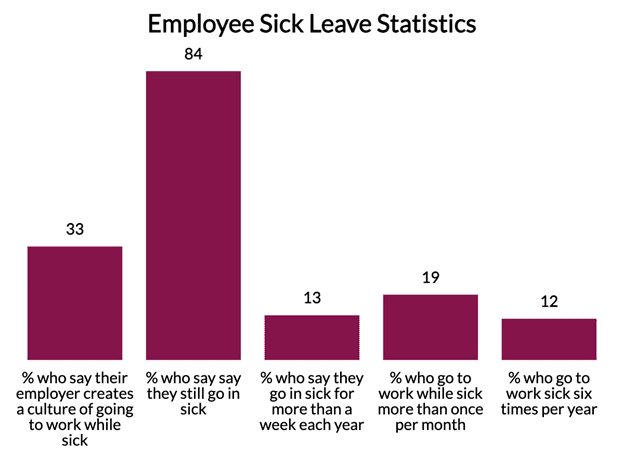
The bottom line is that whatever the cause, most employees go to work sick — some for up to a week per year.
-
33% of respondents say their employer creates a culture of going to work while sick.
-
84% of respondents with PTO say they still go in sick, and 13% say they go in sick for more than a week each year.
-
19% of employees admitted to going to work while sick more than once per month.
-
12% of employees said they go to work sick six times per year.
Additional Paid Time Off Statistics
-
Federal law does not provide for vacation pay, and the Fair Labor Standards Act (FLSA) does not require payment for time not worked. Therefore, employees are not legally entitled to paid vacation time or paid holidays off from work.
-
After taking time off, employees may be more productive, innovative, relaxed, engaged, and balanced.
-
If more Americans converted a portion of their time off to travel, the economic opportunity for the travel industry amounts to $151.5 billion in additional travel spending, which would create two million American jobs.
-
The average PTO length varies substantially depending on several factors, like tenure with a company, public vs. private industries, your geographic location, company policy, collective bargaining agreements, and informal agreements between an employee and management.
-
The larger the company, the more days of paid time off the employees generally have.
-
Employees who report high work-related stress levels are more likely to leave PTO on the table, work while on PTO, and take time off from work to take a mental health day.
Paid Time OFf FAQ
-
What percentage of companies use PTO?
Nearly 100% of companies use some form of PTO. 81.5% of private industry employees have access to paid vacation time, with that number scaling up to 92% for employees at companies of 500+ workers and scaling down to 71% for employees who work at companies with 1-49 workers.
But with 97% of civilian workers receiving paid holidays for Thanksgiving and Christmas, almost all companies provide at least some paid time off each year.
-
What is the average PTO rate?
The average PTO rate is 10 days a year for private-sector employees who have worked for their company for at least one year. Note that this figure does not include sick days or paid holidays, which account for another 7-8 days of paid time off, on average..
-
What is a good PTO accrual rate?
A good PTO accrual rate is 4 hours per bi-weekly pay period. At this rate, you’ll earn 104 PTO hours (13 eight-hour days) over the course of the year. Every 1 hour of bi-weekly PTO accrual equates to 3.25 days of annual PTO (or 26 hours) if you’re looking for a quick way to do the math.
For example, if your PTO accrual rate is 2.8 hours per bi-weekly pay period, you could multiply that by 3.25 to find that you’ll earn 9.1 PTO days (72.8 hours) each year.
https://www.zippia.com/advice/paid-holiday-statistics/
References
USTravel.org. Paid Time Off Trends in the US. Accessed 7/15/21.
Intuit Quickbooks. How Much PTO Should I Give My Employees? Accessed 7/15/21.
U.S. Bureau of Labor and Statistics. Economic News Release – Average Paid Holidays. Accessed 7/16/21.
U.S. Bureau of Labor and Statistics. Employee Benefits Survey. Accessed 7/16/21.
Zenefits.com. How Much is the Average PTO in the U.S.? Accessed 7/16/21.
Society for Human Resource Management. Paid Leave Benchmarking Report. Accessed 7/16/21.
CNBC.com. Here’s how many paid vacation days the typical American worker gets. Accessed 7/16/21.
Patriot Software. Use the Average Vacation Time to Build Your Business’s Policy. Accessed 7/16/21.
Vacation Tracker. What’s the PTO Average in the U.S.? Accessed 7/16/21.
The Balance Careers. Vacation Time and Pay For Employees. Accessed 7/16/21.
- HR Statistics
- Average Labor Cost Percent Of Sales
- Average Time to Reach Profitability At A Startup
- Office Space Per Employee
- Recruitment Statistics
- Employee Engagement Statistics
- Work-Life Balance Statistics
- BYOD Statistics
- Paternity Leave Statistics
- Onboarding Statistics
- Average Paid Maternity Leave In Us
- Average Cost Of A Bad Hire
- Employee Theft Statistics
- Paid Family Leave Statistics
- Cost Of Hiring Statistics
- Employee Turnover Statistics
- Average Cost Of Employer Sponsored Health Insurance Statistics
- Sexual Harassment In The Workplace Statistics
- HR Statistics
- PTO Statistics
Author
Chris Kolmar is a co-founder of Zippia and the editor-in-chief of the Zippia career advice blog. He has hired over 50 people in his career, been hired five times, and wants to help you land your next job. His research has been featured on the New York Times, Thrillist, VOX, The Atlantic, and a host of local news. More recently, he's been quoted on USA Today, BusinessInsider, and CNBC.