- Business Metrics
- Credit Card Statistics
- Customer Retention Statistics
- Advertising Statistics
- CMS Statistics
- CRM Statistics
- Big Data Statistics
- User Experience Statistics
- Black Friday Statistics
- Website Design Statistics
- Supply Chain Statistics
- Live Chat Statistics
- App Revenue Statistics
- Blockchain Statistics
- Online Shopping Statistics
Research Summary. Whether you’re reading an article or watching a YouTube video, you’ll likely run into ads. To understand why and how businesses successfully advertise, we’ve gathered some incredible facts about advertising in the U.S. According to our extensive research:
-
On average, businesses make between $2 and $4 for every $1 spent on advertising.
-
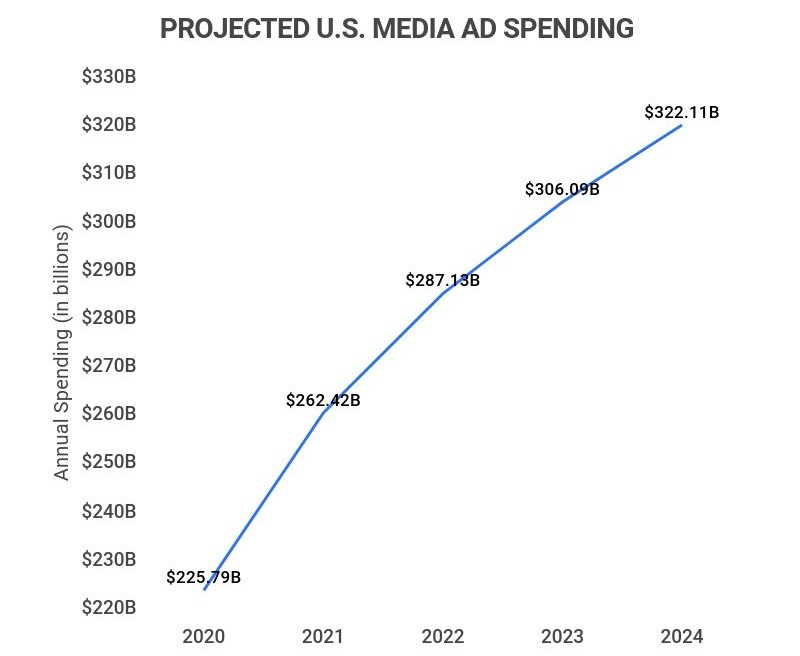
As of 2021, U.S. advertising spending reached $262.42 billion.
-
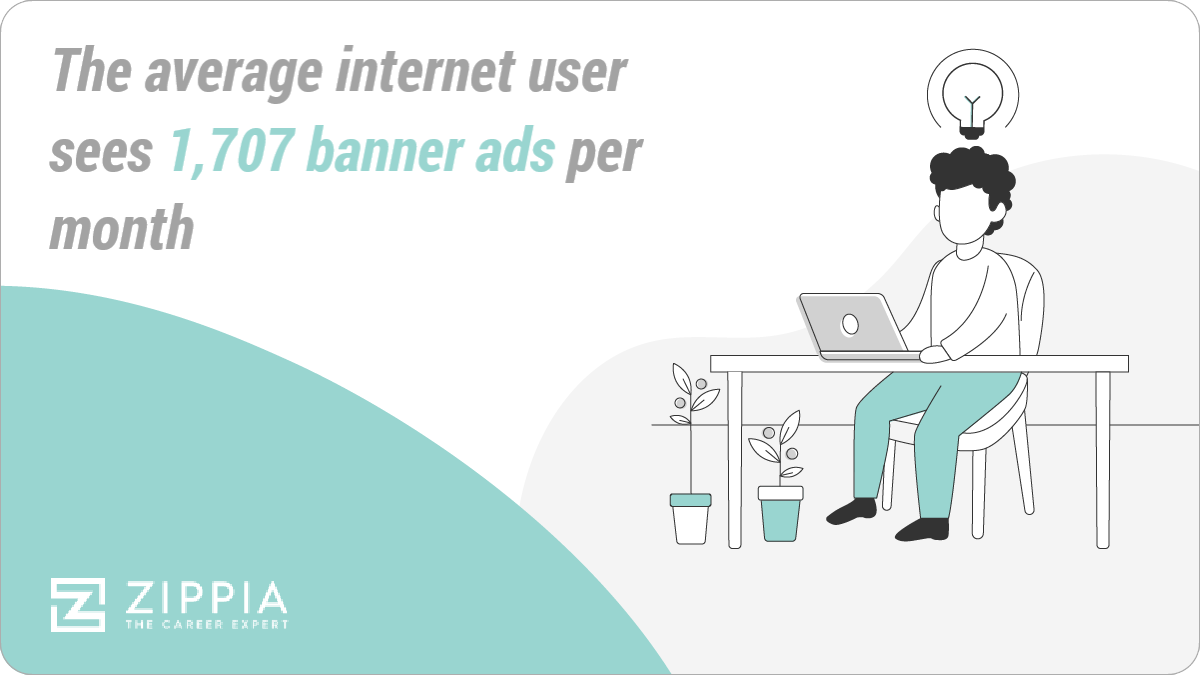
The average internet user is shown 1,707 banner ads each month
-
Google, Amazon, and Facebook account for 64% of all U.S. digital ad spending.
For further analysis, we broke down the data in the following ways:
Digital Advertisement | Consumer Opinions | Tactics | Consumer Behavior | Platforms | Social Media
General Digital Advertising Statistics
As more and more of the global population finds themselves on the internet, so too has digital advertising become more popular. When it comes to general facts about the digital advertising industry, our research shows that:
-
As of 2021, total U.S. company spending on digital advertising reached $171 billion.
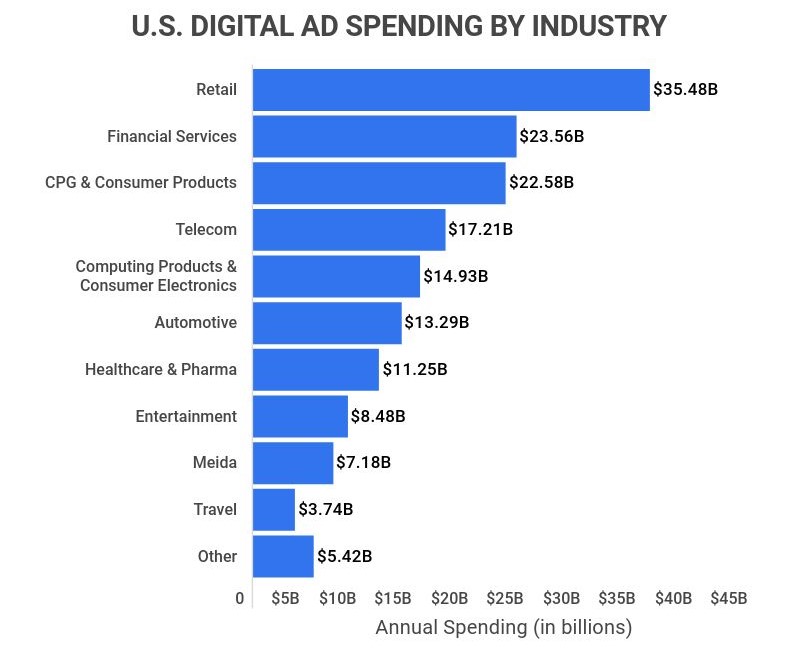
Digital ad spending is huge in the U.S., with nearly every major industry spending well over a billion dollars on it. Overall, the top three industries for digital ad spending include Retail, Financial Services, and CPG & Consumer Products.
-
As of 2022, U.S. companies spent $56 billion on social media advertising.
Over 90% of U.S. companies use social media for advertising purposes, with a majority of these expenses coming from Facebook. In total, Facebook accounts for 80% of expenditures, followed by LinkedIn (4%) and Pinterest (2%).
-
Social media ads represent 33% of all digital ad spending.
Now accounting for one-third of all digital ad spending, social media ads are vital for any company that wants to improve its online presence. Depending on the platform, these ads can greatly improve engagement and conversion rates.
-
Total U.S. advertising agency revenue reached $59.2 billion in 2021.
In the past five years, U.S. advertising agency revenue has been increasing by around 3% year-over-year. This is despite the COVID-19 pandemic, which caused high levels of uncertainty that reduced business and consumer spending.
-
The global advertising market is worth $766 billion.
That means the U.S. market alone makes up roughly 34% of the total global market, which is significant considering the fact that the entire European Union (EU) only makes up around 18% of that market.
Advertising Statistics by Consumer Opinion
The truth is that a lot of consumers don’t like ads or tend to ignore them. That’s why it’s so important to make advertisements that are appealing and easily digestible. Overall, we’ve gathered some general facts you should know about consumer opinions:
-
90% of searchers haven’t made their mind up about a brand before their search.
-
77% of Twitter users appreciate a brand more when their tweet is responded to.
-
56% of online display ads aren’t noticed by consumers.
-
A whopping 90% of U.S. consumers find targeted ads intrusive and annoying.
-
71% of consumers say that ads are even more intrusive than they were three years ago.
-
A considerable 82% of consumers trust print ads more when making a purchase decision.
Advertising Statistics by Marketing Tactics
Given that many Americans find ads annoying and intrusive, it’s critical for businesses to really evaluate their marketing tactics. To understand where marketing tactics currently stand in the U.S., here are some insights our research uncovered:
-
76% of marketers don’t use behavioral data for online ad targeting.
Measuring and using behavior data proves to be incredibly difficult for marketers. For example, only 13% of marketers said that their companies are prioritizing segmented experiences and measuring results. Therefore, if companies struggle to gather data, obviously, they’ll be incapable of using data.
-
The average American is exposed to 4,000-10,000 ads per day.
That’s nearly double the number of ads the average person saw in 2007 and over five times as many ads as the average person saw in the 1970s. Of course, this explosion of advertisements can be attributed to the internet, as social media and other online websites typically have a heavy ad presence.
-
Videos are shared 1,200% more than text and links combined.
Videos are a highly useful tool for modern advertisements. Overall, video content generates 12x more engagement than text and image content combined. In fact, 90% of the information inputted into the brain is visual, and the brain can process these visuals (say in a video advertisement) 60,000X faster than text.
-
Ads that retarget consumers are 70% more likely to convert them.
Retargeting is a highly important practice for advertisers. For instance, only 2% of consumers convert on their first visit to a shop, but that percentage increases by 43% when those customers are retargeted.
Advertising Statistics by Consumer Behavior
Believe it or not, consumer behavior can be noticeably different from consumer opinions. To understand how advertising affects consumer behavior in the U.S., here are some interesting facts about just that:
-
80% of users completely ignore sponsored search results.
-
27% of all internet users find new products through paid social ads.
-
54% of consumers do product research on social media.
-
Millennials and older members of Gen Z watch 40% less traditional TV than they did five years ago.
-
90% of Instagram users follow at least one business/brand.
-
33% of users have bought something directly from an ad they saw on Instagram.
-
The average Clickthrough Rate (CTR) of a search ad is 1.91%, but only 0.35% for a display ad.
-
Consumers are 53% more likely to interact with a native ad over a banner ad.
Advertising Statistics by Advertising Platforms
From social media platforms to personal business websites, or business cards and other physical ads, there are countless ways to advertise your products. Of course, some of these methods are more lucrative than others. Overall, our research shows that:
-
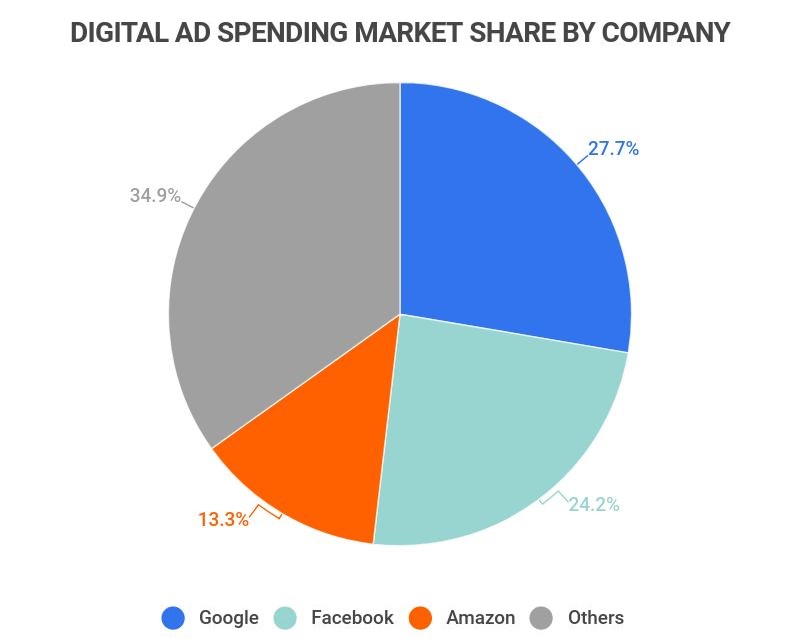
As of 2022, Google has the largest market share of ad spending, at 27.7%.
This is then followed by Facebook with 24.2% and Amazon with 13.3%. All other online advertisers only make up 34.9% of the entire digital advertising market.
-
Instagram ads have the potential to reach 849.3 million users.
Instagram is a highly effective social media platform if you want to get eyes on your products/services. For example, 77% of users see an ad at some point during their session on the platform. That reach is 8.3X more effective than your average gaming ad and 5.4X more effective than most desktop ads.
-
93% of social media marketers use Facebook ads.
It seems most companies and marketers think the cost of Facebook ads is worth it, but what is the average cost. Overall, Facebook ads have a $0.97 cost-per-click (CPC), $7.19 cost-per-thousand-impressions (CPM), $1.07 cost-per-like (CPL), and a $5.47 cost-per-download (CPA).
-
As of 2021, Twitter’s annual revenue reached $5.07 billion.
Over the course of ten years (2011-2021), Twitter’s annual revenue has grown 47X larger. While in 2011, the platform only generated $106 million in revenue, that number is now over $5 billion.
-
TV accounts for 40% of all U.S. ad spending.
TV has dominated the U.S. advertising sphere for decades, but that will likely soon change. As of 2022, digital ad spending has reached 37% of all U.S. ad spending, meaning that it will likely overtake TV ad spending within the next five years.
-
As of 2020, the average conversion rate for email campaigns was 15%.
Email campaigns are a fairly successful method of advertising, but they were more successful in the past. For example, the conversion rate for email campaigns peaked in 2018 when it reached 19%.
-
The average cost-per-click (CPC) of google ads is $2.69.
That’s fairly high, given that the average e-commerce CPC is $0.88, and Facebook’s CPC is only $0.97. However, Google ads do come with the perk of allowing nearly anyone who uses the internet to easily locate your brand.
Advertising Statistics by Social Media Marketing
Social media marketing is all about discovery and relatability. And while it can be difficult to keep up with all of the latest trends, here are some crucial facts about social media marketing:
-
31% of those between 16-24 find new products through paid social ads.
Younger demographics are highly active on social media, and thus, it can be profitable to choose social media when you want to advertise products/services targeted at that age range.
-
52% of online brand discovery happens in public social feeds.
There are ways to maximize engagement on social media feeds, including video posts, relevant hashtags, and paid advertisements.
-
76% of consumers have purchased a product after seeing it on a brand’s social media post.
Social media is a highly effective tool for funneling people into making a sale. For instance, 91% of users will also visit a brand’s website or app after following them on social media.
-
At least 80% of marketers use Instagram for Influencer marketing.
Instagram is one of the most preferred websites for influencer marketing. In fact, 79% of marketers also consider Instagram the most important platform for influencer marketing.
| Respondent Questions | Agree | Disagree |
|---|---|---|
| Ads are appearing in more places | 79% | 4% |
| I'm seeing more ads | 74% | 5% |
| Ads are more intrusive now | 71% | 7% |
| Ads now fit together better across different formats | 47% | 14% |
| Ads tell better stores now | 41% | 24% |
| Ads are more confusing now | 33% | 28% |
Advertising Statistics FAQ
-
How big is the advertising industry?
The global advertising industry is huge, with market size of $766 billion. The U.S. is a large portion of that industry, making up roughly 34% of the total global market ($262 billion). That’s significant, considering the fact that the entire European Union (EU) only makes up around 18% of that market.
-
What industries do the most advertising?
The Retail industry spends the most on advertising, at $35.48 billion in 2021. Behind the Retail industry, others among the top five biggest spenders include: Financial Services ($23.56 billion), CPG & Consumer Products ($22.58 billion), Telecom ($17.21 billion), and Computing Products & Consumer Electronics ($14.93).
-
Is advertising a growing industry?
Yes, the advertising industry is growing. Between 2020-2021, the advertising industry grew by 11.2%. In fact, even though most industries were reeling, or at the least stagnated during the height of the COVID-19 Pandemic, the advertising industry continued to experience steady growth.
-
How many ads does a person see in a day?
The average American is exposed to 4,000-10,000 ads per day. That’s nearly double the number of ads the average person saw in 2007 and over five times as many ads as the average person saw in the 1970s. Overall, this explosion of advertisements can be attributed to the internet, as social media and other online websites typically have a heavy ad presence.
-
What percent of advertising budgets go toward online advertising?
Online or digital advertising makes up roughly 46% of all ad spending. That means that for most companies, nearly half of their advertising budget goes toward online advertising. For reference, that percentage was only 20% in 2010-2011.
-
How many times does someone need to see an ad before they buy?
The average person needs to see a brand, product, or service seven times in ads before they buy. This is known as the Marketing Rule of seven, an expression coined in the 1930s. In the digital age, it’s especially important to target those seven ads and have a social media strategy, as consumers are exposed to far more clutter today than they were in the 1930s.
Conclusion
Advertisements are crucial marketing tools for businesses, but creating a successful ad can be challenging. After all, a whopping 90% of U.S. consumers find targeted ads intrusive and annoying, and 71% of consumers say that ads are even more intrusive than they were three years ago. This leads to the fact that over half of all digital ads go completely ignored.
However, there are strategies you can implement to boost your ads. Social media platforms like Instagram, Facebook, and Twitter are vital tools for success, just as ads with videos and personalized content are.
That’s why 52% of online brand discovery happens in public social feeds, and 76% of consumers have purchased a product after seeing it on a brand’s social media post.
Overall, as the global advertising industry continues to grow and spending continues to increase, it’s more important than ever to hone your advertising strategy. Luckily, you’ll know all of the most important facts and figures.
References
-
Adacado. “All About ROAS – What Is It?” Accessed on May 5th, 2022.
-
Statista. “Media advertising spending in the United States from 2020 to 2024.” Accessed on May 5th, 2022.
-
eMarketer. “Google, Facebook, and Amazon to account for 64% of US digital ad spending this year.” Accessed on May 5th, 2022.
-
IHRSA. “5 Ways to Boost Your Club’s Digital Marketing Results.” Accessed on May 5th, 2022.
-
The Drum. “56% of online display ads are not seen by consumers, claims Google in first ad-viewability study.” Accessed on May 5th, 2022.
-
Ogury. “90% of users find targeted ads annoying: research points to a new solution.” Accessed on May 5th, 2022.
-
eMarketer. “People Believe Ads Are Becoming More Intrusive.” Accessed on May 5th, 2022.
-
Statista. “Digital advertising spending in the United States in 2021, by industry.” Accessed on May 5th, 2022.
-
Statista. “Social network advertising spending in the United States from 2016 to 2022.” Accessed on May 5th, 2022.
-
IBISWorld. “Advertising Agencies Industry in the US – Market Research Report.” Accessed on May 5th, 2022.
-
Smart Insights. “76% of marketers don’t use behavioural data.” Accessed on May 5th, 2022.
-
PPC Protect. “How Many Ads Do We See A Day In 2021?” Accessed on May 5th, 2022.
-
Explainly. “The Value of a Video – Helpful Video Marketing Statistics.” Accessed on May 5th, 2022.
-
Spiralytics. “12 Statistics to Make You Consider Retargeting.” Accessed on May 5th, 2022.
-
Search Engine Watch. “How social media influence 71% consumer buying decisions.” Accessed on May 6th, 2022.
-
Marketing Charts. “The State of Traditional TV: Updated With Q2 2017 Data.” Accessed on May 6th, 2022.
-
MarketingDive. “1/3 of Instagram users have bought directly from an ad, study finds.” Accessed on May 6th, 2022.
-
HubSpot. “What’s a Good Clickthrough Rate? New Benchmark Data for Google AdWords.” Accessed on May 6th, 2022.
-
Business Review. “Banner Ads vs. Native Ads: How They Are Different.” Accessed on May 6th, 2022.
-
MobileMarketing. “Instagram has one of the highest levels of ad effectiveness – report.” Accessed on May 6th, 2022.
-
WebFX. “How Much Does Facebook Advertising Cost in 2022?” Accessed on May 6th, 2022.
-
Statista. “Media advertising spending in the United States from 2020 to 2024.” Accessed on May 6th, 2022.
-
ActiveCampaign. “Email Marketing Conversion Rate.” Accessed on May 6th, 2022.
-
PPCexpo. “Average CPC vs. Average Cost – How to Calculate Avg CPC Using Formula.” Accessed on May 6th, 2022.
-
Bortom. “Social Media.” Accessed on May 6th, 2022.
-
Retail Touch Points. “76% Of Consumers Buy Products Seen In Social Media Posts.” Accessed on May 6th, 2022.
-
Influencer Marketing Hub. “Key Influencer Marketing Statistics You Need to Know for 2022.” Accessed on May 6th, 2022.
- Business Metrics
- Credit Card Statistics
- Customer Retention Statistics
- Advertising Statistics
- CMS Statistics
- CRM Statistics
- Big Data Statistics
- User Experience Statistics
- Black Friday Statistics
- Website Design Statistics
- Supply Chain Statistics
- Live Chat Statistics
- App Revenue Statistics
- Blockchain Statistics
- Online Shopping Statistics
Author
Jack Flynn is a writer for Zippia. In his professional career he’s written over 100 research papers, articles and blog posts. Some of his most popular published works include his writing about economic terms and research into job classifications. Jack received his BS from Hampshire College.