- Business Metrics
- Credit Card Statistics
- Customer Retention Statistics
- Advertising Statistics
- CMS Statistics
- CRM Statistics
- Big Data Statistics
- User Experience Statistics
- Black Friday Statistics
- Website Design Statistics
- Supply Chain Statistics
- Live Chat Statistics
- App Revenue Statistics
- Blockchain Statistics
- Online Shopping Statistics
Research Summary. Big data has permeated the world just as the internet has, and it’s impacting everything from government to entertainment. Here are some statistics on big data:
-
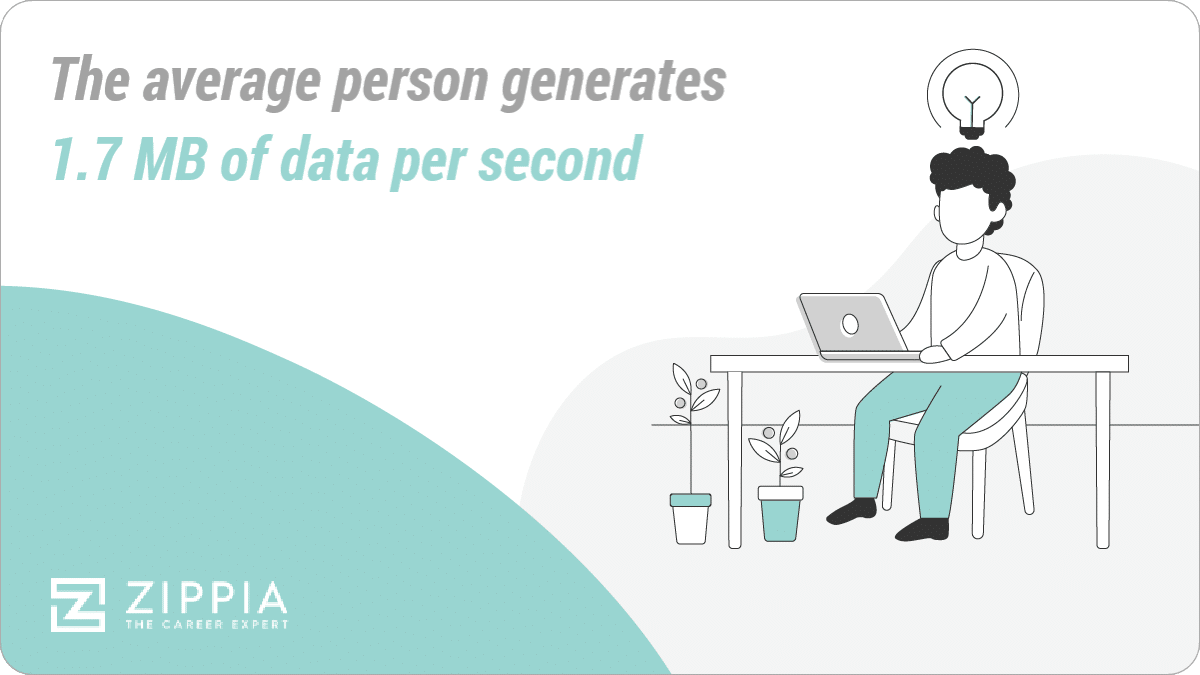
The average person generates 1.7 MB of data per second.
-
The world has 64.2 zettabytes of data as of 2020.
-
97.2% of businesses are investing in big data and AI.
-
The average company analyzes 37-40% of its data.
-
Companies that use big data solutions increase profits by an average of 8%.
-
The global big data market value is more than $56 billion by annual revenue.
For further analysis, we broke down the data in the following ways:
Data Creation | Integration | Solutions | Projections | Industries
General Big Data Statistics
-
90% of the world’s data has been created in the last two years.
-
The average U.S. data breach costs $8.19 million.
-
As of 2022, 60% of corporate data worldwide is stored in the cloud.

Big Data Statistics by Data Creation
-
Collectively, humans produce 2.5 quintillion bytes of data every day.
-
It’s estimated that 1.7 MB of data is created every second for every person on earth.
-
Every minute, Americans use 3.14 million GB of internet data.
Big Data Statistics by Business Integration
-
24% of executives say they’d describe their companies as data-driven.
This was the result of a 2021 survey, and in a 2020 survey asking the same question, 37.8% of executives said they believe their companies were data-driven.
Many experts attribute this decline to unsuccessful attempts to incorporate data-driven decision-making into company cultures, with 92.2% of executives saying this had been a challenge for their organizations.
-
97.2% of business executives say their organizations are investing in big data and AI projects.
These executives cite their desire to become “nimble, data-driven businesses” as the reason for these investments, as 54.4% say that their companies’ inability to do this was the biggest threat they faced.
In addition, 79.4% say they’re afraid that other, more data-driven companies will disrupt and outperform them.
-
The average company doesn’t use 60-73% of its data for analytics.
This means that almost three-quarters of the data companies collect goes unanalyzed and, as a result, unused. This is an important statistic because it does companies no good to collect the data and then not use it to inform future decisions.
Big Data Statistics by Business Solutions and Benefits
-
95% of businesses consider the need to manage unstructured data a problem they face.
In addition, 40% of businesses say they need to manage their unstructured data frequently.
Unstructured data is data like blog posts, emails, and social media posts that can’t easily be put into a spreadsheet or database.
-
Retailers that use big data fully can increase their operating margins by 60%.
This means that if private-sector retail companies collect and analyze their data thoroughly and efficiently, they could use it to put systems in place that would reduce costs by at least 60%.
Similar statistics are given for government administrations as well. In one study, experts found that governments of developed European countries could save $149 billion in operational costs just by putting big data to use.
-
Companies that use big data see an average profit increase of 8%.
They also see a 10% reduction in costs, on average.
Big Data Statistics by Projections
-
The global big data analytics market is expected to earn $68 billion in revenue by 2025.
This is an increase of about $53 billion from the market’s 2019 revenue of $15 billion and is the result of a CAGR of 30% during this time frame.
-
It’s estimated that the world will create, consume, and store over 180 zettabytes of data by 2025.
In 2020, this number was 64.2 zettabytes, which marked a rapid growth in the amount of data the world has created, consumed, and stored during that year. This increase was due to more people working from home and using home entertainment more often during the COVID-19 pandemic.
One zettabyte is equal to one trillion gigabytes or one sextillion bytes.
-
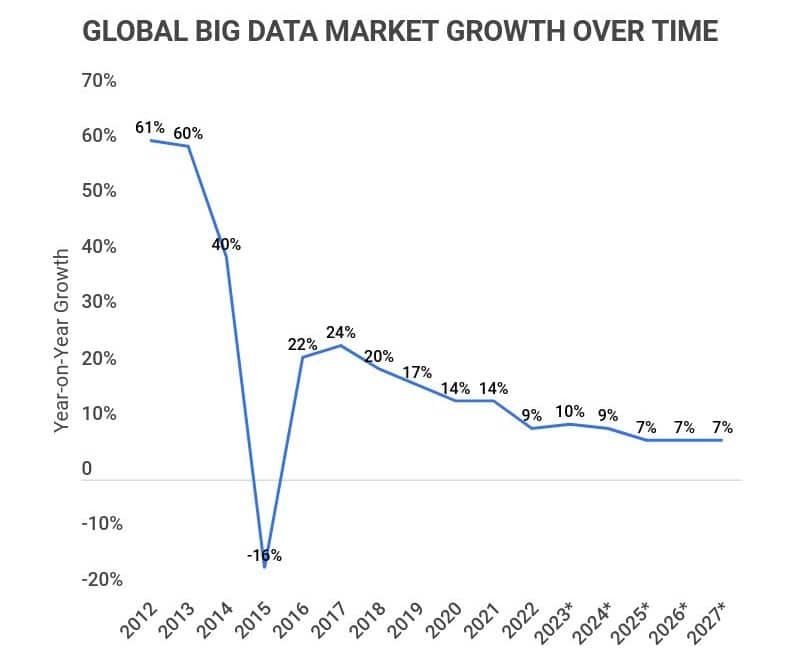
The global big data market is expected to see 10% annual growth in 2023, 9% in 2024, and 7% in 2025, 2026, and 2027.
The global big data market saw the most growth in 2012 when it increased by 61%. It grew by 60% in 2013 and by 40% in 2014 before shrinking by 16% in 2015. The market bounced back quickly, though, growing by 22% in 2016 and seeing growth every year since then.
-
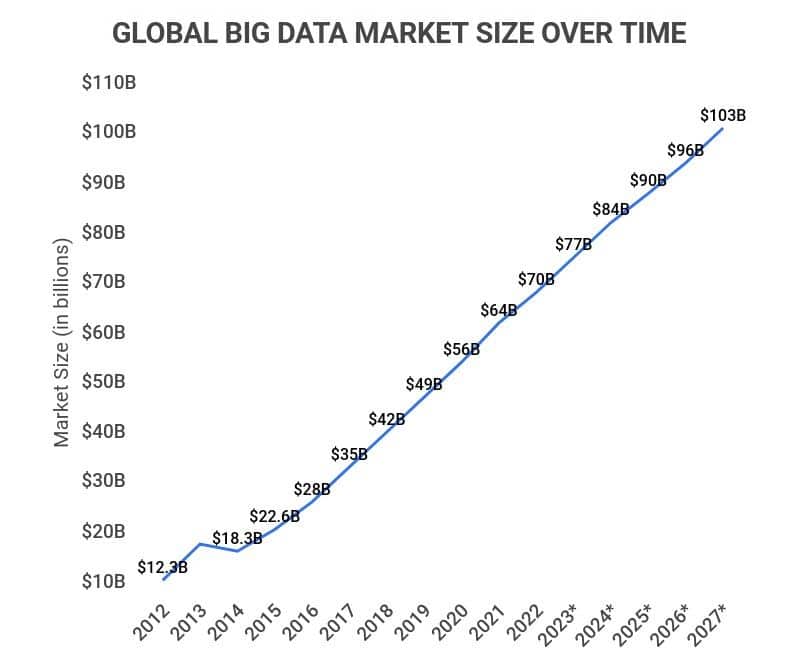
The global big data market is forecasted to earn $103 billion in revenue by 2027.
In 2017, the global big data market was valued at $35 billion by annual revenue, and in 2020, it was worth an estimated $56 billion.
Big Data Statistics by Industries
-
The value of global big data analytics in the healthcare market is estimated to be $23.94 billion.
This is the industry’s value as of 2020, and it’s expected to reach $101.07 billion by 2031.
-
Netflix saved $1 billion in 2016 from big data-driven customer retention.
By listening to its customers through the data it was gathering from them, Netflix was able to provide them with what they really wanted, encouraging viewers to keep their subscriptions.
-
The Empire State Building was able to use big data to reduce its energy consumption by 38%.
This wasn’t just good for the planet; it was also good for the Empire State Building’s bottom line. It didn’t have to add any energy-saving devices to reduce its energy consumption, which meant its efforts translated almost entirely into almost $4.5 billion in savings.
(Some additional monthly cost reductions added to the building’s total savings as well.)
-
Netflix influences 80% of content choices by using big data solutions.
It does this through its recommendation systems that provide viewers with personalized suggestions for the content they might enjoy watching based on their other viewing habits.
Netflix gathers data about when people watch particular shows and movies, what device they watch on, what they re-watch, what they search for, and how they rate shows and movies. It then uses this to suggest new content to viewers and inform the types of content it creates for its platform.
Big Data Statistics FAQ
-
What percentage of companies use big data analytics?
24% of companies use big data analytics. While 97.2% of companies say they’re investing in big data and AI projects, just 24% describe their organizations as data-driven.
In this instance, data-driven means that these companies use the data they collect and analyze to inform their decision-making. So, about three-quarters of companies aren’t actually doing anything with their data.
This is significantly lower than the 37.8% of surveyed executives who said their companies were data-driven in 2020, and many attribute this reduction to having difficulty solidifying data-driven decision-making as a part of their company cultures.
In other words, even if companies have the systems in place to help employees collect and analyze data that they can use in their decision-making, many executives realize that it takes time and buy-in for employees to actually consistently put this into practice.
-
How much is the big data market worth?
The big data market is worth $56 billion. This is based on the market’s annual revenue in 2020.
In 2017, the global big data market earned $35 billion in revenue, and it’s expected to earn $103 billion by 2027.
The global big data analytics market, on the other hand, earned $15 billion in 2019 and is expected to see $68 billion in revenue by 2025. This will be the result of a CAGR of 30% and a revenue increase of $53 billion over the six years between 2019 and 2025.
-
How fast is the big data market growing?
The big data market is growing by about 14% every year. This was its growth rate in both 2020 and 2021, and although it’s expected to keep growing, it’s supposed to see slower rates in 2023 (10%) and 2024 (9%). In 2025, the big data market is only expected to grow by 7%, and the same goes for 2026, 2027, and 2028.
2015 was the only year that the big data market decreased in size, dropping by 16%. This came at the tail end of especially high growth rates from 2012 to 2014 (61%, 60%, and 40%, respectively), and the industry hasn’t grown nearly as much in the years following.
In 2016, the market grew by just 22%, and its growth rate hasn’t breached 24% since then.
-
How much data is generated each day?
2.5 quintillion bytes of data are generated each day. This is the amount that all humans collectively produce around the world by searching, posting, and just generally interacting with the internet.
Each second, it’s estimated that 1.7 megabytes of data are generated for each person on earth. That’s not as a total population or even for the total number of internet users; that’s every human on earth producing 1.7 megabytes of data every single second.
Just looking at the U.S., Americans use 3.14 gigabytes of internet data every minute, whether that’s by sending or reading a text message or email, checking the weather, conducting a Google search, or posting or scrolling on social media.
-
How much data is on the internet?
There are more than 64.2 zettabytes of data on the internet. This was the count as of 2020, and it’s only continuing to go up. By 2025, experts estimate that the world will have created, consumed, and stored more than 180 zettabytes of data via the internet.
For reference, one zettabyte is equal to one trillion gigabytes or one sextillion bytes.
2020 saw a significant spike in the number of bytes created and interacted with, and many experts attribute this to the increase in internet use for work and entertainment during the COVID-19 pandemic lockdowns.
Conclusion
Big data is here to stay, and it’s literally growing by the second: There are 1.7 megabytes of data generated every second for every human on earth. As of 2020, there are 64.2 zettabytes of data that have been created, consumed, and stored in the world, and this is expected to increase to more than 180 zettabytes by 2025.
Companies are getting on board with big data as well, with 97.2% of surveyed executives saying that their organizations are investing in big data and AI. However, the average company only analyzes about 37-40% of the data it collects, rendering much of it useless.
This isn’t for lack of trying, though, as 92.2% of executives also say that weaving data-driven decision-making into their companies’ cultures has been difficult, to say the least. In 2020, 37.8% of executives said they’d describe their organizations as data-driven, while in 2021, that percentage dropped to 24% as data initiatives struggled to take root.
References
-
U.S. Chamber of Commerce Foundation. “Big Data and What It Means.” Accessed on April 26, 2022.
-
Forbes. “What Is the Cost of a Data Breach?” Accessed on April 26, 2022.
-
Statista. “Share of Corporate Data Stored in the Cloud in Organizations Worldwide From 2015 to 2022.” Accessed on April 26, 2022.
-
TheNextTech. “How Much Data Is Produced Every Day 2021?” Accessed on April 26, 2022.
-
DOMO. “Data Never Sleeps 6.0.” Accessed on April 26, 2022.
-
Harvard Business Review. “Why Is It So Hard to Become a Data-Driven Company?” Accessed on April 26, 2022.
-
NewVantage Partners. “Big Data and AI Executive Survey 2019.” Accessed on April 26, 2022.
-
Forrester. “Hadoop Is Data’s Darling for a Reason.” Accessed on April 26, 2022.
-
Forbes. “Big Data Goes Big.” Accessed on April 26, 2022.
-
McKinsey & Company. “Big Data: The Next Frontier for Innovation, Competition, and Productivity.” Accessed on April 26, 2022.
-
Entrepreneur. “How Companies Are Using Big Data to Boost Sales, and How You Can Do the Same.” Accessed on April 26, 2022.
-
Statista. “Big Data Analytics Market Revenue Worldwide in 2019 and 2025.” Accessed on April 26, 2022.
-
Statista. “Volume of Data/Information Created, Captured, Copied, and Consumed Worldwide From 2010 to 2025.” Accessed on April 26, 2022.
-
Statista. “Global Big Data Market Year-on-Year Growth From 2012 to 2027.” Accessed on April 26, 2022.
-
Statista. “Big Data Market Size Revenue Forecast Worldwide From 2011 to 2027.” Accessed on April 26, 2022.
-
Globe Newswire. “Big Data Analytics in Healthcare Market Worth US$101 Billion by 2031: Visiongain Research Inc.” Accessed on April 26, 2022.
-
Datumize. “5 Ways Big Data Promotes Business Growth.” Accessed on April 26, 2022.
-
InsideBIGDATA. “How Netflix Uses Big Data to Drive Success.” Accessed on April 26, 2022.
- Business Metrics
- Credit Card Statistics
- Customer Retention Statistics
- Advertising Statistics
- CMS Statistics
- CRM Statistics
- Big Data Statistics
- User Experience Statistics
- Black Friday Statistics
- Website Design Statistics
- Supply Chain Statistics
- Live Chat Statistics
- App Revenue Statistics
- Blockchain Statistics
- Online Shopping Statistics
Author
Abby is a writer who is passionate about the power of story. Whether it’s communicating complicated topics in a clear way or helping readers connect with another person or place from the comfort of their couch. Abby attended Oral Roberts University in Tulsa, Oklahoma, where she earned a degree in writing with concentrations in journalism and business.