- Business Metrics
- Credit Card Statistics
- Customer Retention Statistics
- Advertising Statistics
- CMS Statistics
- CRM Statistics
- Big Data Statistics
- User Experience Statistics
- Black Friday Statistics
- Website Design Statistics
- Supply Chain Statistics
- Live Chat Statistics
- App Revenue Statistics
- Blockchain Statistics
- Online Shopping Statistics
Research Summary. User experience (UX) is a crucial component of any successful brand. A good user experience can encourage customers to keep coming back, while a bad one can have a catastrophic effect on a business. With that in mind, we’ve gathered some crucial statistics about user experience, and according to our research:
-
88% of online shoppers won’t return to a site after a bad user experience.
-
For every dollar spent on providing a good UX, businesses receive $100 in return. (a 9,900% ROI)
-
Better UX design increases a website’s conversion rates by up to 200%.
-
38% of users will stop interacting with a poorly designed mobile app or website.
-
55% of companies conduct user experience tests.
For further analysis, we broke down the data in the following ways:
Companies | Opinions | Poor UX | Good UX | Mobile

User Experience Statistics by Online Companies
Online companies face a lot of competition, and part of standing out can be having a great user experience. In fact, a good user experience can be one of the most important factors for any company to consider. According to our research:
-
70% of online businesses fail due to bad useability.
Nearly three-fourths of all online businesses fail due to having a bad UX, which highlights just how important UX really is. The fact is that online consumers have access to countless websites, meaning that UX is a crucial method of staying competitive and building loyalty.
-
Slow-loading websites cost business owners $6.8 billion per year.
Slow-loading websites are costly, partially because they drive potential customers away. Believe it or not, after only three seconds of load time, website conversion rates will drop 4.42% with each additional second.
-
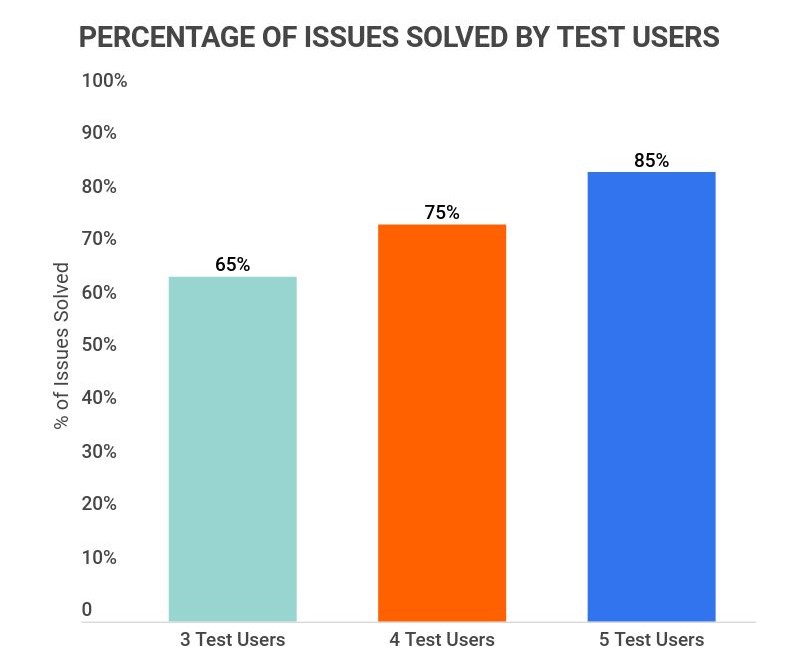
85% of issues can be solved by testing five users.
It doesn’t take an army to figure out what’s wrong with a website, app, or anything else provided by a brand. With four users, businesses can typically catch up to 75% of issues, and even with only three test users, that percentage is still as high as 65%.
User Experience Statistics by User Opinions
It would be nearly impossible to create the perfect user experience without understanding user opinions. After all, user preferences are what drive a good website, app, or product design. In general, here are some interesting facts about user opinions:
-
52% of people say a bad mobile experience makes them lose faith in a company.
-
94% of first impressions are related to your website’s design.
-
85% of users want a mobile experience that’s as good as a desktop.
-
A bad mobile experience annoys 48% of users.
-
96% of customers believe that customer service is essential for brand loyalty.
-
50% of consumers report that a company’s website is vital to the success of their overall brand.
User Experience Statistics by Poor User Experience
As much as a positive user experience can increase company sales and exposure, a negative one can also do a lot of damage. Whether users tell others about their negative experiences or switch to doing business with competitors, here are the facts about how catastrophic a poor UX can be.
-
Following a poor user experience, up to 89% of people have switched to a competitor’s website.
On average, it’ll take users less than 15 seconds to decide whether or not they want to stay on your website, and if they decide to leave, they’re more than likely to switch to a competitor. That’s why it’s so crucial to capture a user’s attention in less than 15 seconds.
-
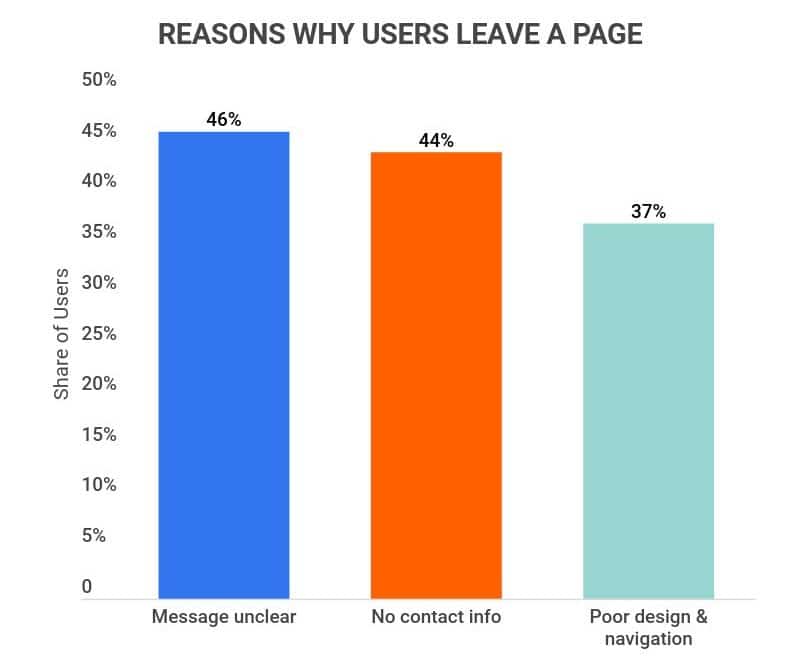
38% of users will stop engaging if the website’s content or layout is unattractive.
Having an ugly or outdated layout doesn’t foster a positive UX. Overall, due to the sheer competition online businesses face, it can be very easy for customers to be turned away by unappealing websites.
-
39% of users won’t engage if a website takes too long to load.
The cold hard truth is that 53% of website visitors will abandon any site that takes longer than three seconds to load. That’s over half of your customer base lost in the time it could have taken you to read this statistic.
-
32% of customers will stop doing business with a brand they love after one bad experience.
In more detail, 17% of U.S. customers reported that they would stop doing business with a brand they love after one bad experience, while 59% would walk away after several bad experiences.
-
52% of users won’t return to an app with bad aesthetics
What does that mean? Well, unfortunately, it can be up to each individual user. One of the best ways to determine if your app has good aesthetics is to provide surveys to your users about their opinions of the app or to hire designers that can provide feedback.
-
70% of users abandon shopping carts due to poor UX.
While shopping cart abandonment is common, nearly three-fourths of users will abandon their cart based on a bad UX alone. That means a bad UX can cost you the majority of your potential sales.
User Experience Statistics by Good User Experience
If it weren’t made obvious already, a positive user experience matters. Whether you’re trying to foster customer loyalty or simply trying to increase conversion rates, here are the facts about what a good UX can do:
-
74% of businesses agree that user experience is vital for boosting sales.
A good UX has an amazing ROI, but did you know that it can also increase your sales by 30%. The fact is that a good UX is extremely valuable, and nearly three-fourths of businesses agree.
-
23% of people who’ve had a positive UX tell ten or more people.
When users have a good UX, word spreads around, just like it will if they have a negative UX. Unfortunately, 13% of users will also tell 15 or more people about a negative UX they’ve experienced on a website.
-
Bounce rate can drop as much as 15% after websites adopt a continuous scroll format.
There’s a reason why you can’t get off Facebook or Instagram, even after telling yourself to stop scrolling. In general, users are far more attuned to websites with scrolling features than they are to ones with carousel images and other formats.
User Experience Statistics by Mobile Experience
More and more people are using mobile devices to access the internet, which means providing a good mobile UX is more important than ever. Knowing that, here are some important facts about the user experience on mobile:
-
Up to 80% of mobile users will leave a website that doesn’t display correctly on their device.
Even more specifically, 53% of mobile users will leave a website that doesn’t display correctly after only three seconds. That means all of the traffic in the world means nothing if a website doesn’t display correctly on someone’s mobile device.
-
Users are five times more likely to leave a website that isn’t optimized for mobile devices.
Poor optimization includes websites that are difficult for users to navigate, have slow loading speeds, and make it hard for users to take action. These traits of a poorly optimized site often occur when the site isn’t formatted with mobile use in mind.
-
52% of users are less likely to engage with a company that doesn’t have a responsive mobile design.
Half of all users will probably turn away from your brand if your website, app, or product is unresponsive on mobile devices. And, given the fact that over half of all U.S. internet traffic now comes from mobile devices, that means you could lose at least a quarter of your potential customers.

User Experience Statistics FAQ
-
How do you measure user experience?
There are over ten ways to effectively measure user experience. To give a brief overview of some of the most effective methods, here are some snippets of information about each one:
-
Average Time on Task. Otherwise known as KPI, this measurement tells you how long a user spends completing a specific task. For the most part, the faster users can complete a task, the better the UX.
-
Error Occurrence Rate. This method highlights common mistakes users make and allows you to further optimize your software to reduce those mistakes.
-
Adoption Rate. This metric shows the number of users gained over a specific time period. It can be valuable to measure the adoption rate when you implement new features, so you can see if that feature has a positive or negative impact.
-
Retention Rate. This measurement will inform you of the percentage of users that continue to use your product long-term. Using it to determine user behavior over a period of one week, one month, three months, six months, and so on can help determine your UX.
-
Net Promoter Score. Otherwise known as NPS, this measurement has users rate the question: “How likely are you to recommend this product to someone else?” on a scale of one to ten, where ten equals very likely, and one equals not likely.
-
Customer Satisfaction. Otherwise known as CSAT, this metric asked customers how satisfied they are with a product on a scale of 1-100. Afterward, the scores are easy to quantify into a percentage.
-
System Usability Scale. Or SUS, this metric provides users with a questionnaire that asks relevant questions about UX. Users have a choice to answer on a scale between “strongly disagree and strongly agree.”
-
-
What are the main elements of a user’s experience?
There are five main elements of a good UX. More specifically, these elements include:
-
Well-organized Information Architecture. This element is concerned with optimizing software in order to enhance usability and findability. In turn, this allows users to effectively locate information and complete tasks.
-
Interaction Oriented Design. This element is all about understanding user behavior in order to design better interactive and personalized experiences for them.
-
Usability Aligned Design. This element entails honing usability so users can effectively attain their end objective without getting confused in any way.
-
Visually Appealing Design. Concerned with aesthetic appeal, this element can improve UX by making a website appear more professional, appealing, and easy to understand.
-
Planned User Research. Last but not least, this element utilizes research about users to create the best UX possible.
-
-
What’s the difference between UX and UI?
UX stands for user experience, while UI stands for the user interface. On a base level, UI is the combination of elements that allows someone to interact with products and services. On the other hand, the overall experience taken away from that same product or service is the UX.
For example, a gaming app might have an incredible and easy-to-use UI, but if the overall product (i.e., the game) is bad, then users will likely still have a negative UX.
-
What’s the most important part of UX design?
The most important part of UX design is understanding the users themselves. In other terms, any successful UX design comes from intensive user research. That way, you’ll know what your customers want and why.
Conclusion
User Experience (UX) is a crucial part of creating and maintaining a successful website, app, product, or service. The fact is that for every dollar spent on providing a good UX, businesses receive $100 in return. (a 9,900% ROI), not to mention that a better UX design increases a website’s conversion rates by up to 200%.
With that in mind, it’s clear to see that investing in UX is vital. Luckily, achieving a great UX through a bit of know-how, customer research, and intuitive software is easier than ever.
Sources:
-
Forbes. “How UX Is Transforming Business (Whether You Want It To Or Not).” Accessed on April 28th, 2022.
-
Medium. “7 findings that prove the importance of great UX.” Accessed on April 28th, 2022.
-
Entando. “4 UX Stats & What They Mean For You.” Accessed on April 28th, 2022.
-
Transaction. “$6.8 Billion Dollars Are Lost Annually as a Result of Slow-Loading Website.” Accessed on April 28th, 2022.
-
Invision. “Why 5 is the magic number for UX usability testing.” Accessed on April 28th, 2022.
-
CXL. “First Impressions Matter: Why Great Visual Design Is Essential.” Accessed on April 28th, 2022.
-
Gartner. “Key Findings From the Gartner Customer Experience Survey.” Accessed on April 28th, 2022.
-
HubSpot. “16 Types of Customer Needs (and How to Solve for Them).” Accessed on April 28th, 2022.
-
OpenWeb. “The 15 Second Rule: What’s Making Your Visitors Leave?” Accessed on April 28th, 2022.
-
Transaction. “38% of people will leave a website if they find the layout unattractive.” Accessed on April 28th, 2022.
-
Transaction. “39% of People Will Stop Engaging With a Website if Images Won’t Load or Take Too Long to Load.” Accessed on April 28th, 2022.
-
PWC. “Experience is everything: Here’s how to get it right.” Accessed on April 28th, 2022.
-
RedSignal. “72% of the Customers Abandon Shopping Cart Sales Due to Bad User Experience.” Accessed on April 28th, 2022.
-
TheGrowthHub. “Increase Your Sales by 30%: Why User Experience Is Crucial.” Accessed on April 29th, 2022.
-
Poynter. “Time.com’s bounce rate down 15 percentage points since adopting continuous scroll.” Accessed on April 29th, 2022.
-
MarketingDive. “Google: 53% of mobile users abandon sites that take over 3 seconds to load.” Accessed on April 29th, 2022.
-
Google Ads Help. “Optimize your website for mobile.” Accessed on April 29th, 2022.
- Business Metrics
- Credit Card Statistics
- Customer Retention Statistics
- Advertising Statistics
- CMS Statistics
- CRM Statistics
- Big Data Statistics
- User Experience Statistics
- Black Friday Statistics
- Website Design Statistics
- Supply Chain Statistics
- Live Chat Statistics
- App Revenue Statistics
- Blockchain Statistics
- Online Shopping Statistics
Author
Jack Flynn is a writer for Zippia. In his professional career he’s written over 100 research papers, articles and blog posts. Some of his most popular published works include his writing about economic terms and research into job classifications. Jack received his BS from Hampshire College.