- Business Metrics
- Credit Card Statistics
- Customer Retention Statistics
- Advertising Statistics
- CMS Statistics
- CRM Statistics
- Big Data Statistics
- User Experience Statistics
- Black Friday Statistics
- Website Design Statistics
- Supply Chain Statistics
- Live Chat Statistics
- App Revenue Statistics
- Blockchain Statistics
- Online Shopping Statistics
Research Summary. Mobile apps have been on the rise ever since they became the core tenant of smartphones in the early 2000s. Consumers and investors alike should be aware of some important growing trends in the app industry. These include:
-
Global consumer spending on apps reached $170 billion in 2021.
-
This is an 18.88% increase from 2020 consumer spending, which topped off at $143 billion.
-
48% of mobile app revenue comes from in-app purchases.
-
By 2023, the total revenue of mobile apps is projected to be $935 billion.
For further analysis, we broke down the data in the following ways:
Revenue Models | Trends | Segments | App Store vs Play Store | App Downloads

App Revenue Statistics by Revenue Models
-
Around 5% of users make in-app purchases.
Though it may not seem like a large number, 5% is a significant amount of users who are willing to spend extra money while using an app. Having such a consistent consumer base is important for growth.
-
In 2021, in-app advertising revenue reached $288 billion.
Much of app revenue comes from advertising. This makes sense when you consider that many apps are free and have to collect revenue from advertisements.
-
56% of apps use a subscription model.
Many apps are retaining their users by using the subscription model. This allows apps certain flexibility in their price modeling because subscriptions are not necessarily tied to a one-off purchase.
-
14% of mobile app revenue comes from the top 100 non-gaming apps.
As this stat implies, non-gaming apps provide a small but important slice of revenue to the mobile app industry. Of course, gaming apps provide the lion’s share.
-
48% of apps have in-app purchases.
One way to engage with consumers is to provide in-app purchases. This is a helpful model for free apps that still look for ways to collect revenue.
-
The average value per app user is estimated to be $3.52. In the United States, the average consumer spent $10.64 in 2021 on apps.
Although many apps are free, users still provide revenue for the industry. Most users are willing to pay a fair amount, as long as the price is reasonable compared to the service provided.
-
iOS users accounted for 78% of subscription revenue.
This statistic shows that iOS users are more likely to pay for subscription-based apps. One theory for this could be that iOS-only apps are usually integrated into the Apple technology infrastructure.
App Revenue Statistics by Trends and Projection
-
Global app revenue increased by nearly $100 billion between 2020 and 2021.
As this table shows, each year, apps are bringing in more revenue year after year.
Year Revenue (billions) 2016 $100 2017 $177.6 2018 $217.5 2019 $255.5 2020 $318.6 2021 $400.7 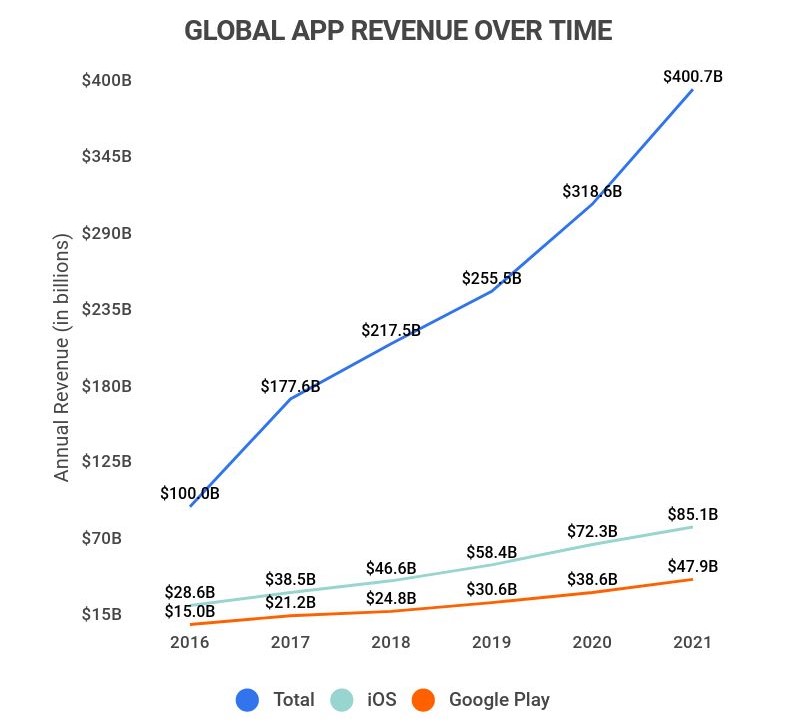
-
Apps from the Google Play store have provided a large share of revenue.
Below, this table highlights the share Google’s app store brings in for revenue.
Year Revenue (billions) 2016 $15 2017 $21.2 2018 $24.8 2019 $30.6 2020 $38.6 2021 $47.9 -
Apple’s iOS has consistently brought in large shares of revenue in the mobile app industry.
This table shows that Apple continues to be a huge market player for mobile apps.
Year Revenue (billions) 2016 $28.6 2017 $38.5 2018 $46.6 2019 $58.4 2020 $72.3 2021 $85.1 -
There were 143.6 billion first time app installs in 2021.
This stat shows there is no shortage of demand for apps. Roughly 20 apps were downloaded by every person on the planet.
-
By 2025, the projected consumer spending on mobile apps will reach $270 billion.
Consumers are going to continue to pay for certain apps. This means that the growing app market will see more entrepreneurial entries to entice customers.
App Revenue Statistics by App Segments
-
Mobile game revenue in 2021 was $252.2 billion.
Mobile games account for a large portion of total mobile app revenue. This is likely because most mobile games have a high enough demand for consumers to bring in revenue.
-
Games accounted for 67% of total app revenue in 2021.
Mobile games are a big player in the mobile app industry. For anyone interested in breaking into the market, gaming is a great place to start.
-
77% of people have a retail app.
Retail apps are important to the retail industry. They provide direct connections between consumers and retailers. Along the way, the apps provide special discounts and membership awards that help retain customers.
-
In 2020, the top five sectors of revenue for mobile apps were gaming, social networking, entertainment, photo/video, and lifestyle.
Gaming is by far the largest source of revenue for apps. Other sectors provide some revenue but are likely hampered by the free services many of them are expected to provide.
Sector Amount (billions) Share Gaming $200.1 62.8% Social Networking $31.4 9.9% Entertainment $21.5 6.7% Photo & Video $12.5 3.9% Lifestyle $8.3 2.6%
App Revenue Statistics: Apple App Store vs. Google Play Store
-
Consumers spent $85.1 billion in the iOS app store in 2021.
iOS provides the biggest share of the revenue from app stores. This could be due to the fact iOS brings in more subscribers as consistent streams of revenue.
-
Consumers spent $47.9 billion in the Google Play store in 2021.
The Google Play store comes in second for mobile app revenue. Many people use Android and that means they will use the Google Play store to download their apps.
-
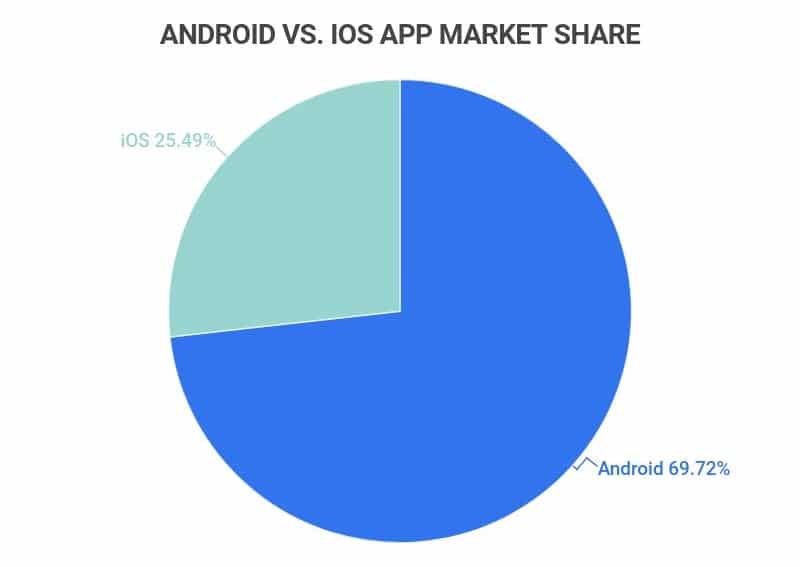
Google/Android accounts for 69.72% of the market share, while iOS accounts for 25.49%.
Although iOS brings in more revenue, Google/Android still dominates the market share. This might imply that Google/Android is more popular, and their apps cost less than those found on iOS.
-
Both Apple and Google take 30% of in-app purchases, but after one year, they reduce it to 15%.
Apple and Google are sure to take a cut from app purchases. To maintain good relations with app developers, they reduced their fees after one year. This is because if an app is still successful after one year, there is a good chance it will continue.
-
Apple and Google combined makes $89.6 billion in revenue for gaming apps.
Broken down, iOS took in about $52.3 billion, and Google Play took in $37.3 billion. Again, iOS takes the lead in revenue.
App Revenue Statistics by App Downloads
-
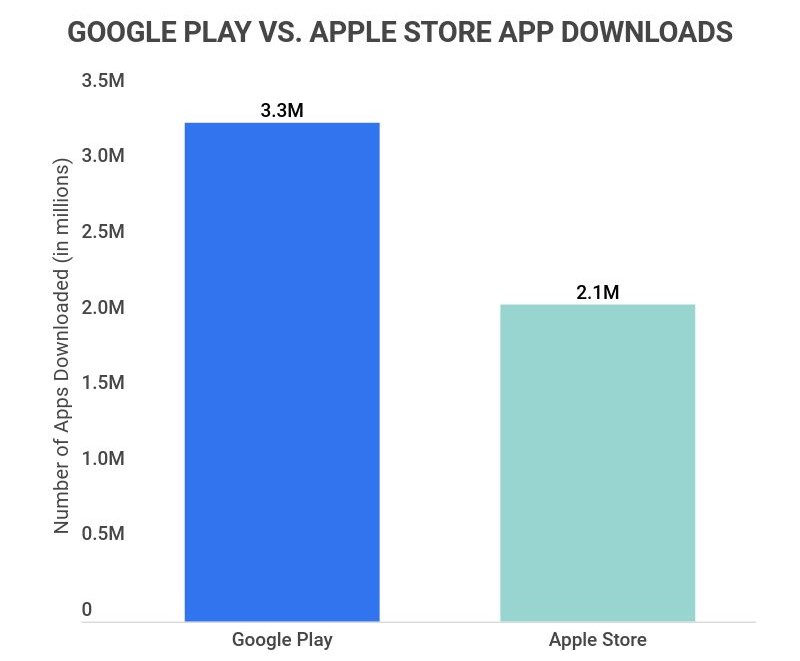
Google Play offers more apps than the Apple Store.
Google Play offers 3.3 million apps compared to the Apple Store’s 2.1 million.
-
TikTok was the most downloaded app in 2021.
With 656 million downloads in 2021, TikTok was the most popular app in 2021.
-
Social media leads the way with the most downloads for mobile apps in 2021.
As this table shows, social media apps are the most popular to download.
App Downloads (millions) TikTok 656 Instagram 545 Facebook 416 WhatsApp 395 Telegram 329
App Revenue Statistics FAQ
-
What percentage of apps make money?
It is estimated that only 0.5% of apps make money. Yes, that’s right, 0.5%. This is something to consider if you are thinking of getting into the mobile app business. Though not impossible, it is very difficult to see a profit.
This is likely caused by a variety of factors. For one, the competition is immense. There are millions of apps and likely more to come. A lot of apps provide similar services, which makes it hard to stand out.
Also, many consumers expect apps to be free, but if yours is riddled with advertisements or in-app purchases, then you might lose customers.
-
How much money does an app with 1 million downloads make?
It varies depending on the app. A free app with 1 million downloads will only make money from advertising and/or in-app purchases. An app that you will have to pay for will obviously make money from its downloads, but it must be popular enough in the first place to reach that million download threshold.
-
Free apps can make money. A big source of revenue for free apps comes from advertising. Much like broadcast TV or radio stations, advertising allows an app to secure customers without asking for a fee.
Free apps can also make money through in-app purchases, which leave it up to the consumer to decide whether or not they wish to spend money. Finally, there is always the “freemium” option, in which an app can be free, but a better, premium version of the app is available for a price.
-
What type of app makes the most money?
Gaming apps make the most money by far. In 2020, they accounted for 62% of the total global revenue for mobile apps. They are the biggest cash grabs in both the Apple Store and the Google Play app store, accounting for nearly $90 billion in combined revenue.
Games are likely to be the best source of money because they can build consistent customer bases. Gamers are always looking for new games, and if they like the game a lot, they are willing to spend money on it. Mobile games are also a huge source of entertainment for the modern consumer that can be provided at any time of the day.
-
Yes, the app industry is growing, and it is growing to big heights. The projected CAGR for the mobile industry is 6.58%, with global revenue expected to exceed $430 billion in 2022.
Mobile technology is now a huge part of our daily lives, so it should be no surprise that mobile apps are on the rise. Apps provide the basic framework to make mobile technology user-friendly. Without them, much of the mobile industry would be inaccessible to the average consumer.
-
How competitive is the mobile app industry?
Yes, the app industry is growing, but it is also very competitive. Many entrepreneurs are trying to break into the industry, yet many consumers are overwhelmed by choices and expect most services to be free.
With so many businesses and stakeholders involved, it is up to an app company to be unique and provide a service that consumers are willing to commit to.
Conclusion
The app industry is a serious source of revenue, with projected global revenue of over $400 billion dollars in 2022. That being said, it is also a very competitive industry. Only 0.5% of mobile apps make money. Most other apps are free or fail. Therefore, if you want to get into the app industry, you have to know about the effort it takes to succeed.
This is not impossible. As the statistics show, there are many ways to make money through mobile apps. In-app purchases and advertising are great revenue streams for apps that want to be free to download. The type of app is also important. If revenue is important for you, then you would want to focus on the gaming or social media sectors of the app industry.
Applications are fundamental to mobile technology. They help consumers navigate the important services and make the process of a mobile phone more user-friendly. This is why many tech and communication companies are concerned about their mobile app presence. Having a successful app is a great way to retain customers and build loyalty.
Apps are a wonderful tool that has become deeply integrated into our society. They help with recreational, social, and professional needs. Clearly, apps are a force to be reckoned with and are here to stay.
References
-
Statista. “Leading markets based on mobile apps consumer spending in 2021.” Accessed April 28, 2022.
-
Invesp. “Global In-app Purchase Revenue Statistics and Trends.” Accessed April 28, 2022.
-
Serp Watch. “App Usage Statistics 2022: Downloads, Revenue, Popularity.” Accessed April 28, 2022.
-
Statista. “Mobile advertising spending worldwide from 2007 to 2024.” Accessd April 28, 2022.
-
Statista. “Most popular mobile app business models as of June 2019, by usage and monetization.” Accessed April 28, 2022.
-
Sensor Tower. “Global Consumer Spending in Top 100 Subscription Apps Climbed 41% to $18.3 Billion in 2021.” Accessed April 28, 2022.
-
Statista. “Average mobile app user acquisition costs worldwide from September 2018 to August 2019, by user action and operating system.” Accessed April 28, 2022.
-
Sensor Tower. “Global Consumer Spending in Mobile Apps Reached $133 Billion in 2021, Up Nearly 20% from 2020.” Accessed April 28, 2022.
-
Statista. “Mobile app consumer spending worldwide from 2020 to 2025, by store.” Accessed April 28, 2022.
-
GameIndustry.biz. “Newzoo: Mobile game revenue generated $93.2bn in 2021.” Accessed April 28, 2022.
-
Cision. “Nearly 80% of People Use Shopping Apps While at Home, and Most Use Them Frequently – At Least 2-5 Times a Week.” Accessed April 28, 2022.
-
Statista. “App.” Accessed April 28, 2022.
-
Apple Insider. “Android loses 8% market share while iOS grows.” Accessed April 28, 2022.
-
Fyresite. “Why 99.5% Of Consumer Apps Fail (And How To Keep Yours Alive).” Accessed April 28, 2022.
-
Forbes. “Top 10 Most Downloaded Apps And Games Of 2021.” Accessed April 28, 2021.
- Business Metrics
- Credit Card Statistics
- Customer Retention Statistics
- Advertising Statistics
- CMS Statistics
- CRM Statistics
- Big Data Statistics
- User Experience Statistics
- Black Friday Statistics
- Website Design Statistics
- Supply Chain Statistics
- Live Chat Statistics
- App Revenue Statistics
- Blockchain Statistics
- Online Shopping Statistics
Author
Conor McMahon is a writer for Zippia, with previous experience in the nonprofit, customer service and technical support industries. He has a degree in Music Industry from Northeastern University and in his free time he plays guitar with his friends. Conor enjoys creative writing between his work doing professional content creation and technical documentation.