Research Summary. While not the largest Social Media platform in the world, Instagram is still a major hub for sharing photos and videos, as well as promoting brands. In fact, Instagram is one of the most important places to market, as shown by our extensive research:
-
As of 2021, Instagram has roughly 2 billion monthly active users.
-
81% of Instagram users use the platform to research new products and services.
-
At least 95 million photos and videos are posted on Instagram each day.
-
The average user spends 53 minutes per day on Instagram.
-
90% of Instagram users follow at least one business.
For further analysis, we broke down the data in the following ways:
Demographics | User Behavior | Business Profiles | Product Discovery | Trends
General Instagram Statistics
Though Instagram is considerably younger than some of its counterparts, like YouTube and Facebook, the platform is still vastly popular. To understand how big Instagram is and why it’s such an important platform, here are some general facts about the site:
-
As of 2021, there are over 500 million Instagram Stories users.
From 2016-2018 alone, the number of Instagram Stories users increased from 100 million to 400 million. For context, that’s a considerable 400% increase.
-
At least 95 million photos and videos are posted on Instagram every day.
That means that even if the average person only spent one second looking at each photo or video, it would still take them three years to go through one day’s worth of Instagram content. And believe it or not, over 40 billion photos have been shared on the site since its conception.
-
17.6% of the global population uses Instagram.
And in the United States, those numbers are even higher, as 41% of the American population (138 million people) now use Instagram.
-
At least 500 million Instagram users access the platform daily.
Instagram is becoming more popular for daily use, as at least one-fourth of the platform’s total monthly active users also use it once a day as well.
-
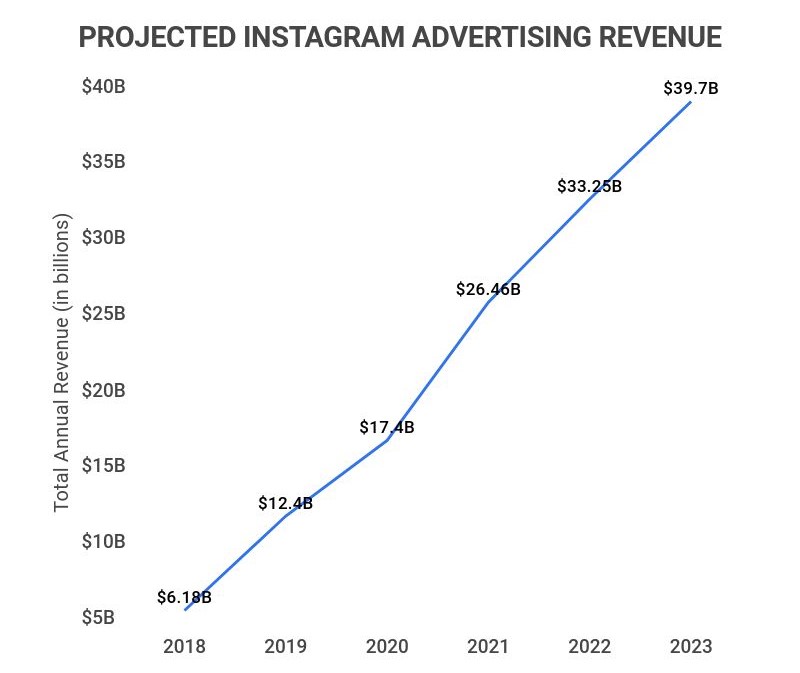
Instagram’s annual ad revenue in 2021 was $26.46 billion.
That’s a 328% increase from 2018 when the platform’s ad revenue was only $6.18 billion. Additionally, this revenue is only expected to grow exponentially larger, poised to reach $39.7 billion by 2023.
-
Instagram’s total annual revenue in 2020 was $24 billion.
Instagram’s total annual revenue has been increasing steadily since 2015 when the social media site only gained $500 million dollars. Since then, Instagram’s annual revenue has shot up to $24 billion, growing 47X larger in only five years.
Year Revenue (in billions) 2015 $0.5B 2016 $1.8B 2017 $4.1B 2018 $10.3B 2019 $17.7B 2020 $24B -
Instagram is the fourth largest social media platform based on MAUs (monthly active users).
Instagram has 2 billion monthly active users, making it the fourth-largest social media platform. Others among the top five include: Facebook (2.9 billion), YouTube (2.2 billion), WhatsApp (2 billion), and Facebook Messenger (1.3 billion).
Social Media Platform MAUs Facebook 2.9B YouTube 2.2B WhatsApp 2B Instagram 2B Facebook Messenger 1.3B WeChat 1.26B TikTok 1B Sina Weibo 573M QQ 539M Telegram 550M
Instagram Statistics by User Demographics
As with any social media platform, certain demographics use Instagram more than others. When comparing Instagram users based on gender, age, and other demographics, our extensive research shows that:
-
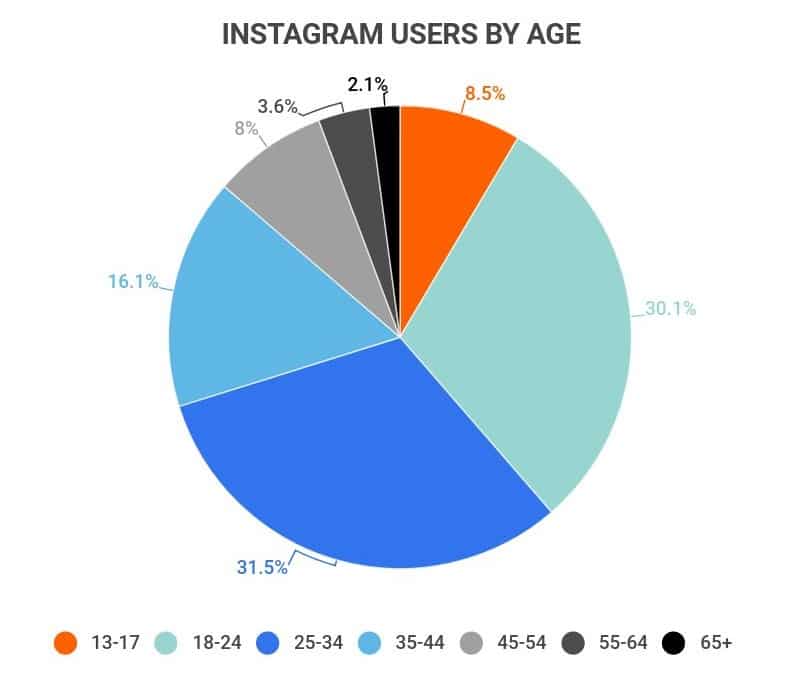
Those between the ages of 25-34 make up the largest percentage of Instagram users, at 31.5%.
While those between 25-34 make up the largest age demographic of Instagram users, those 18-24 aren’t far behind at 30.1% of users. The percentage of users drops off from there, with 8.5% of users being 13-17, 8% being 45-54, and 5.7% being 55+.
-
15% of teens report Instagram as the app they use most often.
While this is a considerable portion, Instagram isn’t the most popular app teens use. In fact, more teens report Snapchat and YouTube as their most widely used apps, with 35% and 32% saying so, respectively.
-
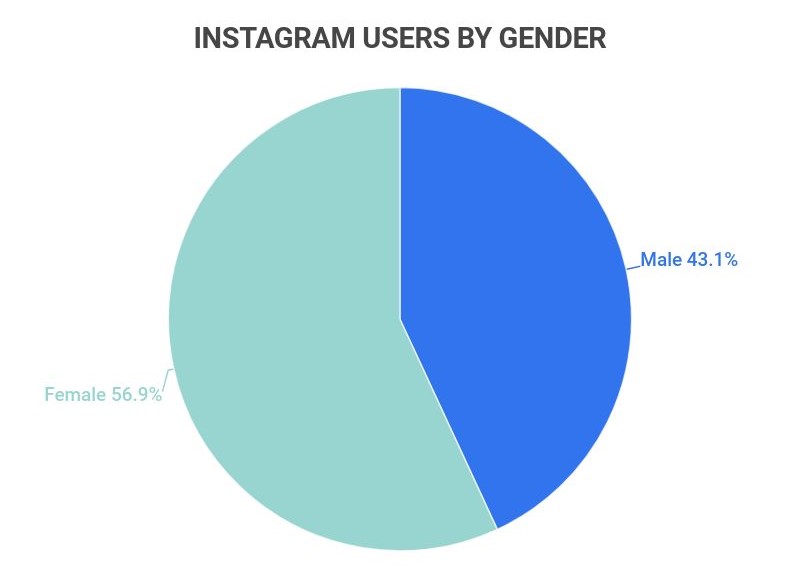
56.9% of Instagram users are women.
As opposed to 43.1% being men, what’s more is that this gender disparity is the same across all ages. For instance, there are 10% more female users in the 25-34 age category and 25% female users in the 45-54 age category.
-
India has the most Instagram users, at 230.25 million.
Others among the top five countries with the most Instagram users include: the United States (159.75 million), Brazil (119.45 million), Indonesia (99.15 million), and Russia (63 million).
Country Audience Size (in millions) India 230.25M United States 159.75M Brazil 119.45M Indonesia 99.15M Russia 63M Turkey 52.15M Japan 46.1M Mexico 37.85M United Kingdom 31.75M Germany 29.85M
Instagram Statistics by User Behavior
Instagram wouldn’t be so popular if it didn’t have features that set it apart from other social media platforms. This, combined with user demographics, can affect the platform’s user behavior. According to our research:
-
Instagram has the highest engagement rate of any social media platform, at 2-7% per post.
While that might not seem like a lot, sites like Facebook often receive less than half of 1% engagement per post, making Instagram’s numbers pretty impressive. After all, if there are 500 million people using the site every day, that means each post could see up to 35 million engagements.
-
Instagram posts with only one hashtag receive up to 12% more engagement.
Surprisingly, having only one or two hashtags is the best way to gain more engagement on Instagram. In fact, posts with three or more hashtags actually get less engagement on average than those with none.
-
60% of U.S. Instagram users log in at least once per day.
The majority of Instagram users use the platform every day, but they aren’t even the most frequent users. In fact, 38% of U.S. users access Instagram multiple times per day.
-
Cristiano Ronaldo has the most followers on Instagram, at 366 million.
This world-famous Portuguese soccer player has more followers than any other human on the platform. In fact, Ronaldo was the first person to reach 200 million Instagram followers.
Others among the top five most-followed accounts include: Kylie Jenner (281 million), Lionel Messi (281 million), Dwayne ‘The Rock’ Johnson (278 million), and Ariana Grande (275 million).
Person/Account Number of Followers (in millions) Cristiano Ronaldo 366M Kylie Jenner 281M Lionel Messi 281M Dwayne ‘The Rock’ Johnson 278M Ariana Grande 275M Selena Gomez 272M Kim Kardashian 263M Beyoncé 217M Justin Bieber 202M Kendall Jenner 199M
Instagram Statistics by Business Profiles
Instagram is a popular social media platform for marketing, in part due to its high engagement. To understand the business side of Instagram, here are some interesting facts about just that:
-
71% of U.S. Businesses use Instagram.
And the U.S. isn’t the only country where Instagram marketing is popular, as there are over 200 million business profiles on the platform worldwide.
-
Brand-posted stories on Instagram have an 87.2% monthly completion rate.
Unlike other social media platforms, consumers are highly likely to watch Instagram stories to completion. For context, story completion rates for sites like Facebook and YouTube can be as low as 40-50%.
-
The average brand posts four to five Instagram stories per week.
In general, brands tend to post around 17 stories per month, but these numbers can be much higher for top brands. For example, the top 25% of most successful brands on Instagram tend to post stories up to seven times per week (once per day).
-
Roughly 70% of all Instagram hashtags are branded.
These are hashtags that are created by businesses to promote their own brand. Some of the most common examples of these include:
-
#ShareACoke by Coca-Cola.
-
#LikeAGirl by Always.
-
#OreoHorrorStories by Oreo.
-
#letsdolunch by Domino’s Pizza.
-
#OpenYourWorld by Heineken.
-
Instagram Statistics by Product Discovery
As mentioned previously, many consumers follow brands and research products on Instagram. This practice is common, leading to many businesses finding a home on the platform. Overall, here are the facts about how users discover products on Instagram:
-
90% of Instagram users follow at least one business.
-
72% of users report that Instagram content helps influence their buying decisions.
-
33% of users have bought something directly from an ad they saw on Instagram.
-
58% of consumers are more interested in a brand after seeing it in an Instagram Story.
-
26% of Instagram users used the platform for social commerce purchases in 2020.
-
96% of U.S. fashion brands use Instagram for marketing purposes.
Instagram Trends and Projections
Instagram might be the fourth most popular social media platform by MAUs, but that hasn’t always been the case. Further, just because Instagram claims the fourth place spot now doesn’t mean that won’t change in the future. To understand where Instagram might be headed, here are some interesting trends and projections:
-
Between 2015 and 2020, Instagram’s annual revenue grew 47X larger.
In 2015, Instagram’s annual revenue was only $500 million, a number that grew to $24 billion in 2020. On average, the platform’s revenue grew by an astonishing 150-175% each year.
-
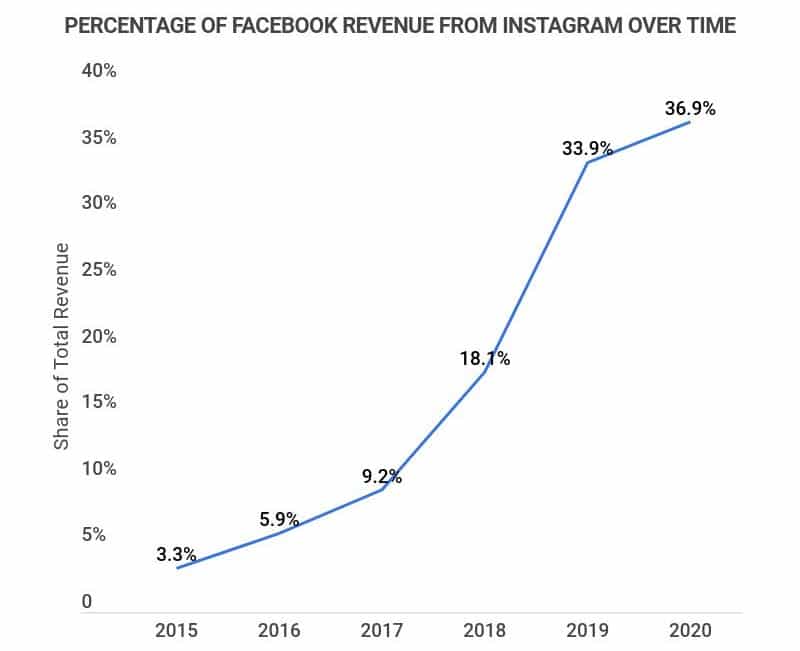
Between 2015 and 2020, Instagram’s revenue as a portion of Facebook’s total revenue grew by over 1,000%.
In 2015, Instagram only accounted for 3.3% of Facebook’s total revenue. However, that percentage has since risen to a whopping 36.9% in 2020.
-
Between 2013 and 2020, the number of annual Instagram users increased by 1,080%.
Growing over 10X larger since 2013, Instagram’s number of annual users increased from 110 million in 2015 to 1.3 billion in 2020. Further, that number only continues to climb at a consistent rate.
Year Number of Annual Users 2013 110M 2014 200M 2015 370M 2016 500M 2017 700M 2018 1B 2019 1.1B 2020 1.3B
Instagram Statistics FAQ
-
How many active users are on Instagram?
There are currently 2 billion monthly active users on Instagram. This includes users around the world and in the United States. From 2013 to 2020, Instagram’s number of annual users increased by over 1,000%, from 110 million to 1.3 billion. It’s also worth noting that Instagram’s MAUs make it the fourth largest social media platform in the world based on that metric.
-
Is Instagram decreasing in popularity?
Yes and no. While Instagram’s growth has declined from 6.7% in 2019 to only 1.8% projected in 2023, both of those numbers still show positive trends. For the most part, there are a few reasons why Instagram is growing more slowly and losing popularity. These reasons include:
-
Instagram has already grown rapidly, resulting in less novelty and fewer newcomers.
-
Instagram is most popular with Millennials, and Gen Z is more interested in apps like TikTok.
-
Instagram has pivoted toward e-commerce, making it less popular with certain users.
-
-
Is TikTok more popular than Instagram?
TikTok is not more popular than Instagram yet. Yet being the important caveat. Currently, Instagram has at least 1.3 billion annual users, while TikTok has around 1 billion. On its own, that means Instagram is larger.
However, TikTok has been growing rapidly in recent years. In 2020 alone, TikTok’s user growth was 85.3%, compared to Instagram’s 22.9%. If these trends persist, TikTok’s active users will eventually surpass Instagram’s.
-
What percentage of Facebook revenue is from Instagram?
As of 2020, 36.9% of Facebook’s revenue came from Instagram. This percentage has increased consistently and rapidly over time. For example, in 2015, Instagram only accounted for 3.3% of Facebook’s total revenue. However, that percentage has since risen to 36.9%. That’s an increase of 1,000% in only five years.
-
The two major demographics who use Instagram the most are Women and Millennials. Women are more likely to use the platform than men, with 56.9% of Instagram users being women compared to 43.1% being men.
And in the case of generation, 61.6% of those who use Instagram are between the ages of 18-34, and a majority within that age group would be considered Millennials.
Conclusion
As the social media platform with the fourth-largest number of MAUs in the world, Instagram is a force to be reckoned with. In fact, the platform has seen its number of users increase ten times over within only five years, and its revenue increase by 47X within that same time period.
While Gen Z may be showing less interest in Instagram going forward, the platform is still one of the best out there for branding and digital marketing. Overall, with high engagement and conversion rates, businesses can expect to continue making a profit off Instagram.
Sources:
-
Statista. “Number of monthly active Instagram users from January 2013 to December 2021.” Accessed on April 24th, 2022.
-
MediaKix. “How Many People Use Instagram Stories? [User Growth Chart].” Accessed on April 24th, 2022.
-
NapoleonCat. “Instagram users in United States of America.” Accessed on April 24th, 2022.
-
Statista. “Annual Instagram advertising revenues in the United States from 2018 to 2023.” Accessed on April 24th, 2022.
-
BusinessofApps. “Instagram Revenue and Usage Statistics (2022).” Accessed on April 24th, 2022.
-
Buffer. “20 Top Social Media Sites to Consider for Your Brand in 2022.” Accessed on April 24th, 2022.
-
Statista. “Distribution of Instagram users worldwide as of January 2022, by age group.” Accessed on April 25th, 2022.
-
Hootsuite. “Instagram Demographics in 2022: Most Important User Stats for Marketers.” Accessed on April 25th, 2022.
-
Statista. “Leading countries based on Instagram audience size as of January 2022.” Accessed on April 25th, 2022.
-
Mention. “Social Mythbusters: Does Using Instagram Hashtags Mean More Engagement?” Accessed on April 25th, 2022.
-
Brandwatch. “The Top 20 Most Followed Instagram Accounts.” Accessed on April 25th, 2022.
-
Flick. “Completion Rate on Instagram: Everything you need to know.” Accessed on April 25th, 2022.
-
RivalIQ. “How Often to Post on Social Media.” Accessed on April 25th, 2022.
-
Retail TouchPoints. “72% Of Users Make Purchase Decisions Based On Instagram Content.” Accessed on April 25th, 2022.
-
MarketingDive. “1/3 of Instagram users have bought directly from an ad, study finds.” Accessed on April 25th, 2022.
-
eMarketer. “US adoption of Instagram shopping exploded in 2020, though it’s already slowing.” Accessed on April 25th, 2022.


