- Determine Your Worth
- Average Salaries In The US
- What Is A Salary Range?
- What Is A Base Salary?
- What Is A Pay Grade?
- Average Salary Out Of College
- Your Salary History
- Competitive Pay
- Salary Vs. Hourly Pay
- What Is A Job Classification?
- How Many Hours Can A Teen Work?
- Average Work Hours Per Week
- What Is Annual Income
- Gross Salary
- How Many Hours Is Full Time
- How Many Work Hours In A Year
- Minimum Wage For Workers Who Receive Tips
- New York State Minimum Wage Rates
- Get A Raise
- Benefits
- Paid Time Off Policy (PTO)
- Leave of Absence Policy
- What Are Floating Holidays?
- What Are Employer-Paid Holidays?
- How Does Holiday Pay Work
- How Does A Stipend Work
- Cash a Paycheck Without a Bank Account
- What Is Compensatory Time?
- What's Unlimited Vacation?
- What Is A Commission?
- What Is A Mileage Deduction?
- Semimonthly Vs Biweekly Pay Schedules
- Flexible Spending Account
- Stock Options At Job
- Benefits Package
- Overtime Pay
- Workers Comp
- What Is Fmla
- Hazard Pay
- Tuition Reimbursement
- Discretionary Vs. Non-Discretionary Bonus
- What Are Union Benefits
- What Is An HRA Account
- What Is Cobra Insurance
- Negotiation
- What Exactly Is a Job Offer?
- How To Negotiate Salary
- Exempt Employee
- How To Answer Salary Requirements
- Employment History
- What Are Your Salary?
- Salary Counter Offer
- How To Answer Salary Expectations
- How Many Hours Is Part Time
- Signing Bonus
- Cost Of Living Adjustment
- How To Ask For A Salary Advance
- What Is Fair Labor Standards Act
Find a Job You Really Want In
Research Summary. The average salary in the U.S. continues increasing every year and currently sits at $47,520 per year. However, what an individual earns fluctuates depending on multiple factors, including age, gender, education level, occupation, and race.
After extensive research, our data analysis team concluded:
-
2021 data indicate the weekly median wage in the U.S. is $990, or $47,520 per year.
-
Annual U.S. salaries can vary by more than 75%, depending on the occupational group.
-
While there remains a significant salary gap between men and women, those aged 45 to 54 earn the most.
-
Individuals with higher education levels typically earn greater salaries—more than double, in some instances—than those with less education.
-
Asian workers typically earn the highest salaries, followed by White, Black, and Hispanic employees.
-
Among salary levels, 16.5% of U.S. households earn between $50,000 and $74,999, followed by $100,000 to $149,999 (15.3%) and $35,000 to $49,999 (11.6%).
General U.S. Salary Statistics
While the mean U.S. salary is more than $56,000 annually, more than 11% of the U.S. population currently lives at or below poverty thresholds.
-
As of May 2020, the median hourly wage in the U.S. was $20.17, the mean hourly wage was $27.07, and the annual mean wage was $56,310.
-
In the second quarter of 2021, the median weekly earnings of full-time workers were $990, or $47,520 per year.
-
According to one Pew Research study, middle-income earnings vary between $40,100 and $120,400 per year.
-
In 2018, 52% of U.S. adults lived in middle-income households, with 29% in lower-income households and 19% in upper-income households.
-
In May 2020, 37.2 million Americans—or 11.4% of the U.S. population—lived in poverty. This was a 1% increase over 2019, which represented the lowest recorded rate since 1959.
| U.S. Poverty Threshold | |
|---|---|
| Size of Family Unit | Weighted Average Threshold (Annual) |
| One person (unrelated individual) | $13,171 |
| Under age 65 | $13,465 |
| Aged 65 and older | $12,413 |
| Two people | $16,733 |
| Householder under age 65 | $17,413 |
| Householder aged 65 and older | $15,659 |
| Three people | $20,591 |
| Four people | $26,496 |
| Five people | $31,417 |
| Six people | $35,499 |
| Seven people | $40,406 |
| Eight people | $44,755 |
| Nine people or more | $53,905 [1, 2, 7, 12, 13, 14] |
Average Salary Statistics by Occupational Group
U.S. workers employed in management ($126,480) and legal ($112,320) occupations earn the most per year, while those who work in serving/food preparation ($27,650) and healthcare support ($32,250) occupations earn the least. Here’s a complete breakdown:
| Average Salary by Major Occupational Group | |||
|---|---|---|---|
| Occupation Group | Median Hourly Wage | Mean Hourly Wage | Annual Mean Wage |
| Management | $52.77 | $60.81 | $126,480 |
| Business and Financial Operations | $34.73 | $38.79 | $80,680 |
| Computer and Mathematical | $43.92 | $46.53 | $96,770 |
| Architecture and Engineering | $39.98 | $43.41 | $90,300 |
| Life, Physical, and Social Science | $33.54 | $38.15 | $79,360 |
| Community and Social Service | $22.85 | $25.09 | $52,180 |
| Legal | $40.82 | $54.00 | $112,320 |
| Educational Instruction and Library | $25.18 | $28.75 | $59,810 |
| Arts, Design, Entertainment, Sports, and Media | $25.55 | $30.96 | $64,400 |
| Healthcare Practitioners and Technical | $33.59 | $41.30 | $85,900 |
| Healthcare Support | $14.40 | $15.50 | $32,250 |
| Protective Service | $21.02 | $25.11 | $52,220 |
| Food Preparation and Serving-Related | $12.26 | $13.30 | $27,650 |
| Building and Grounds Cleaning and Maintenance | $14.39 | $15.75 | $32,760 |
| Personal Care and Service | $13.52 | $15.68 | $32,610 |
| Sales and Related | $15.15 | $22.00 | $45,750 |
| Office and Administrative Support | $18.62 | $20.38 | $42,390 |
| Farming, Fishing, and Forestry | $14.27 | $16.02 | $33,310 |
| Construction and Extraction | $23.37 | $25.93 | $53,940 |
| Installation, Maintenance, and Repair | $23.44 | $25.17 | $52,360 |
| Production | $18.00 | $20.08 | $41,760 |
| Transportation and Material Moving | $16.38 | $19.08 | $39,680 [1] |
Average U.S. Salary by State and Territory
Workers in the District of Columbia ($95,330) earn significantly more per year than employees in other states. Massachusetts ($70,010) and California ($65,740) rank second and third, respectively.
At the other end of the spectrum, workers in Puerto Rico ($30,750) earn the least, followed by Guam ($37,470) and Mississippi ($41,600).
| Average Salary by State and Territory for All Occupations | |||
|---|---|---|---|
| State | Median Hourly Wage | Mean Hourly Wage | Annual Mean Wage |
| Alabama | $17.43 | $22.52 | $46,840 |
| Alaska | $24.45 | $29.69 | $61,760 |
| Arizona | $19.35 | $25.67 | $53,400 |
| Arkansas | $16.51 | $21.53 | $44,780 |
| California | $22.74 | $31.61 | $65,740 |
| Colorado | $22.52 | $29.25 | $60,840 |
| Connecticut | $24.57 | $31.46 | $65,450 |
| Delaware | $20.72 | $27.26 | $56,700 |
| District of Columbia | $38.29 | $45.83 | $95,330 |
| Florida | $18.07 | $24.05 | $50,020 |
| Georgia | $18.59 | $24.97 | $51,940 |
| Guam | $13.50 | $18.01 | $37,470 |
| Hawaii | $22.44 | $27.98 | $58,190 |
| Idaho | $17.79 | $22.50 | $46,800 |
| Illinois | $21.01 | $27.92 | $58,070 |
| Indiana | $18.56 | $23.39 | $48,650 |
| Iowa | $19.19 | $23.69 | $49,280 |
| Kansas | $18.59 | $23.37 | $48,610 |
| Kentucky | $17.90 | $22.11 | $46,000 |
| Louisiana | $17.53 | $22.34 | $46,460 |
| Maine | $19.45 | $24.62 | $51,220 |
| Maryland | $23.43 | $30.58 | $63,610 |
| Massachusetts | $25.75 | $33.66 | $70,010 |
| Michigan | $19.67 | $25.67 | $53,390 |
| Minnesota | $22.41 | $28.23 | $58,720 |
| Mississippi | $15.73 | $20.00 | $41,600 |
| Missouri | $18.70 | $24.10 | $50,140 |
| Montana | $18.20 | $22.73 | $47,270 |
| Nebraska | $19.16 | $24.16 | $50,260 |
| Nevada | $18.55 | $24.21 | $50,360 |
| New Hampshire | $21.22 | $27.27 | $56,730 |
| New Jersey | $23.14 | $30.62 | $63,690 |
| New Mexico | $17.97 | $23.87 | $49,650 |
| New York | $23.84 | $32.62 | $67,850 |
| North Carolina | $18.63 | $24.52 | $51,010 |
| North Dakota | $21.26 | $25.22 | $52,450 |
| Ohio | $19.37 | $24.77 | $51,510 |
| Oklahoma | $17.84 | $22.76 | $47,340 |
| Oregon | $21.04 | $27.34 | $56,880 |
| Pennsylvania | $20.08 | $25.94 | $53,950 |
| Puerto Rico | $10.62 | $14.78 | $30,750 |
| Rhode Island | $22.77 | $28.96 | $60,240 |
| South Carolina | $17.36 | $22.22 | $46,230 |
| South Dakota | $17.70 | $21.62 | $44,960 |
| Tennessee | $18.00 | $22.85 | $47,530 |
| Texas | $19.06 | $25.19 | $52,400 |
| U.S. Virgin Islands | $18.55 | $23.06 | $47,960 |
| Utah | $18.98 | $24.73 | $51,430 |
| Vermont | $20.80 | $25.68 | $53,420 |
| Virginia | $21.74 | $28.92 | $60,160 |
| Washington | $24.81 | $32.15 | $66,870 |
| West Virginia | $17.07 | $21.82 | $45,380 |
| Wisconsin | $19.79 | $24.64 | $51,250 |
| Wyoming | $20.69 | $24.61 | $51,180 [1] |
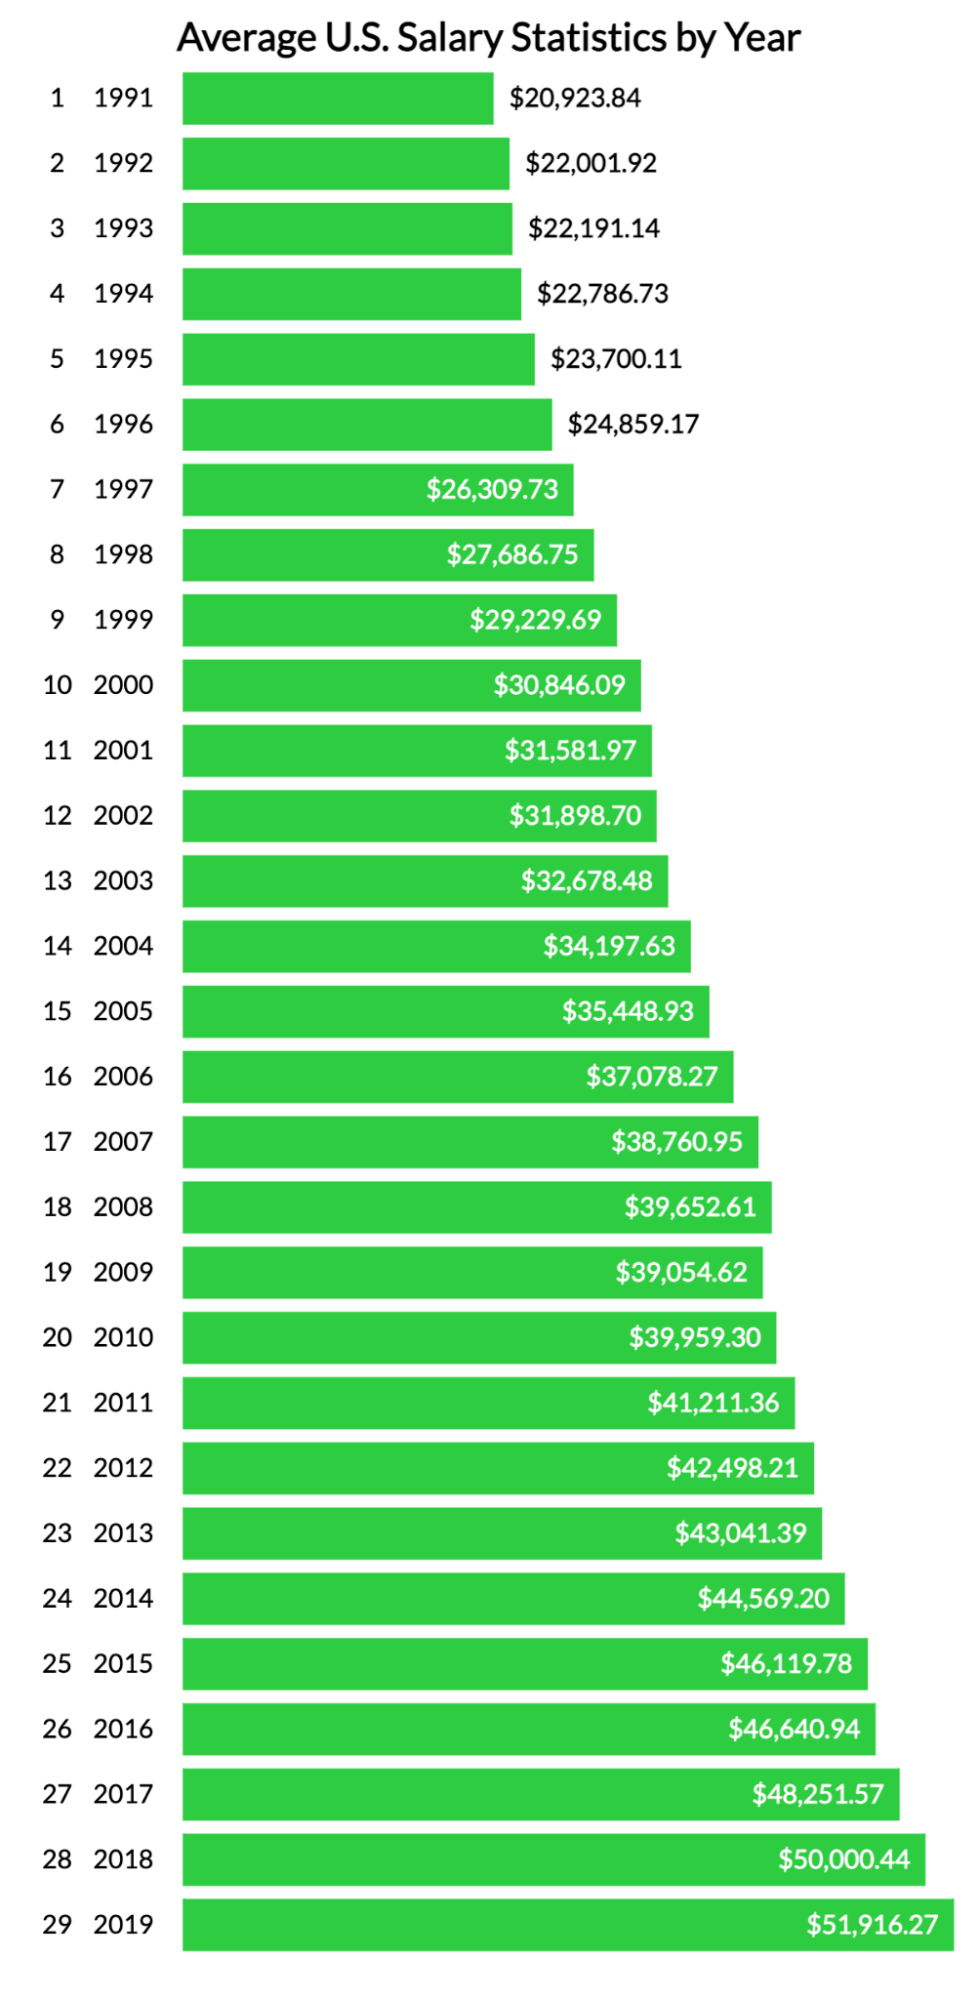
Average U.S. Salary Statistics By Year
In the U.S., workers’ average net compensation has increased year after year since 1991. The most significant increases occurred recently between 2018 and 2019 ($1,916) and between 2017 and 2018 ($1,749).
Here’s how all the numbers have played out since 1991:
-
1991: $20,923.84
-
1992: $22,001.92
-
1993: $22,191.14
-
1994: $22,786.73
-
1995: $23,700.11
-
1996: $24,859.17
-
1997: $26,309.73
-
1998: $27,686.75
-
1999: $29,229.69
-
2000: $30,846.09
-
2001: $31,581.97
-
2002: $31,898.70
-
2003: $32,678.48
-
2004: $34,197.63
-
2005: $35,448.93
-
2006: $37,078.27
-
2007: $38,760.95
-
2008: $39,652.61
-
2009: $39,054.62
-
2010: $39,959.30
-
2011: $41,211.36
-
2012: $42,498.21
-
2013: $43,041.39
-
2014: $44,569.20
-
2015: $46,119.78
-
2016: $46,640.94
-
2017: $48,251.57
-
2018: $50,000.44
-
2019: $51,916.27[4]
Average U.S. Salary Statistics by Gender
The U.S. has one of the most significant wage disparities between men and women globally, although the gap has continuously narrowed since 1979. Still, women of all races earn meaningfully less than men for the same position.
-
As of the second quarter of 2021, women had median weekly earnings of $899, or 82.2% of the $1,094 median for men. Comparably, women’s earnings were 62% of men’s in 1979, 70% during the 1980s, 77% during the 1990s, and between 80% and 83% since 2004.
-
Based on race and ethnicity, white women earned 82.6% as much as their male counterparts, compared with:
-
85.1% for Black women;
-
70.4% for Asian women;
-
86.5%for Hispanic women.
-
-
Men and women employed in management, professional, and related occupations earned the highest median weekly salary of $1,586 and $1,195, respectively. On the other hand, men and women employed in service occupations made the least at $713 and $586 per week, respectively.
-
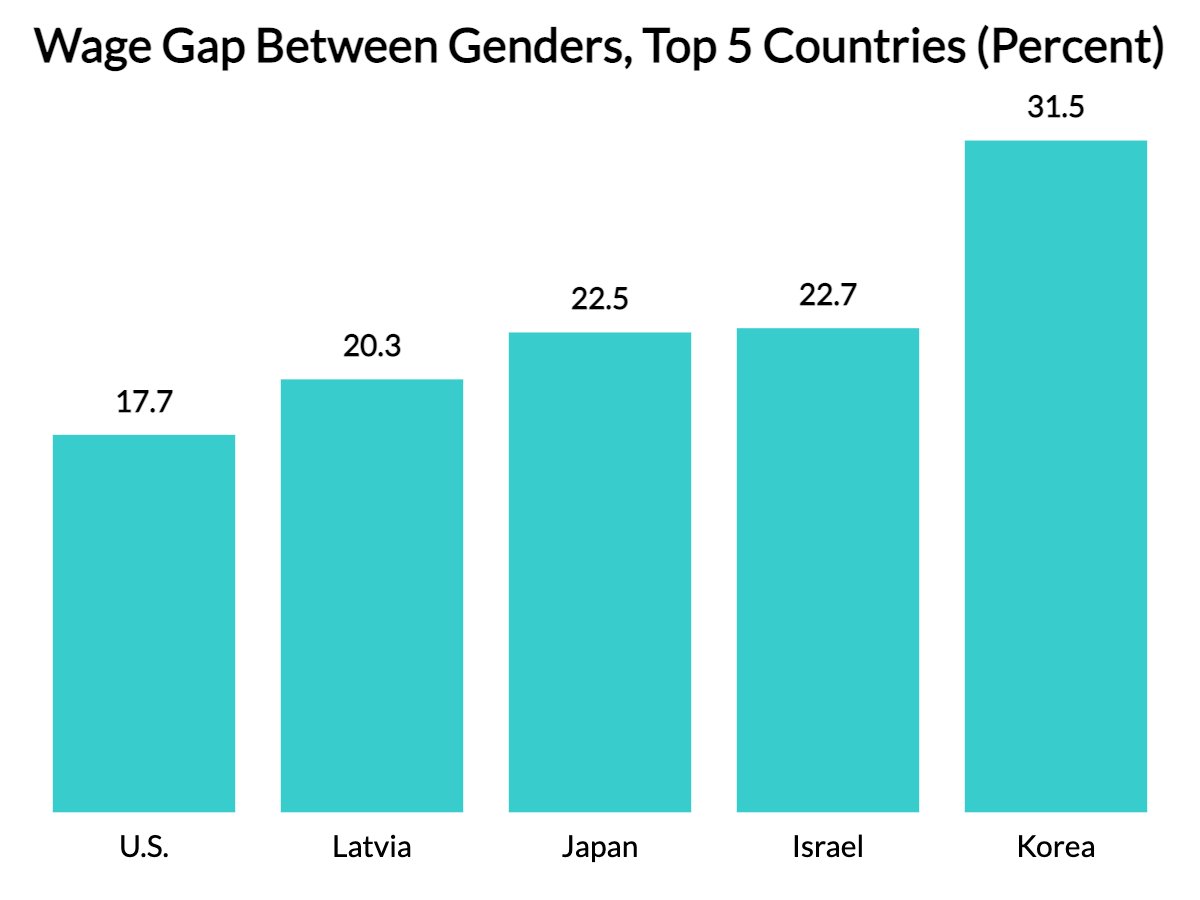
In 2020, the U.S. had one of the largest wage gaps between genders (17.7%), outpaced only by Latvia (20.3%), Japan (22.5%), Israel (22.7%), and Korea (31.5%). [2, 5]
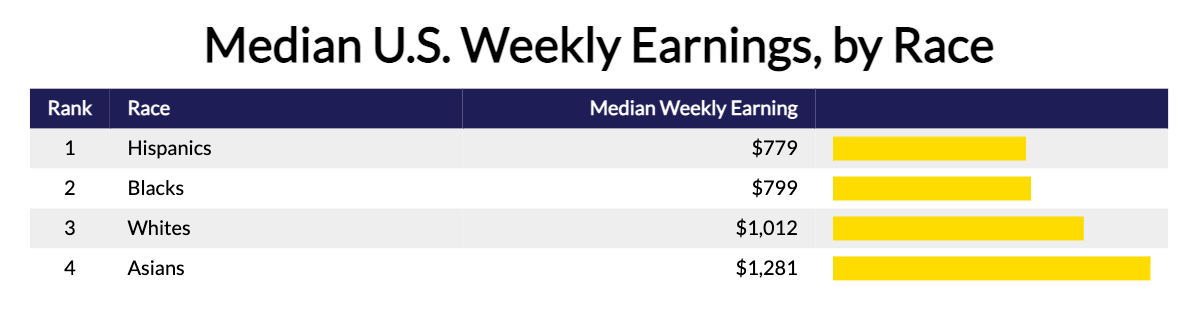
U.S. Salary Statistics by Race
On average, White workers earn more than Black and Hispanic employees, but not more than Asian workers.
-
As of 2021, for full-time jobs, the median weekly earnings of Blacks ($799) and Hispanics ($779) were lower than those of Whites ($1,012) and Asians ($1,281).
-
The median weekly earnings for Black men were $877, or 78.7% of the median for White men ($1,115).
-
Median earnings for Hispanic men were $825, or 74% of the median for White men.
-
Black women’s median earnings were $746, or 81% of those for White women ($921).
-
Hispanic women’s earnings were $714, or 77.5% of those for White women.
-
Asian men’s ($1,473) and women’s ($1,037) earnings were meaningfully higher than their White counterparts. [2]
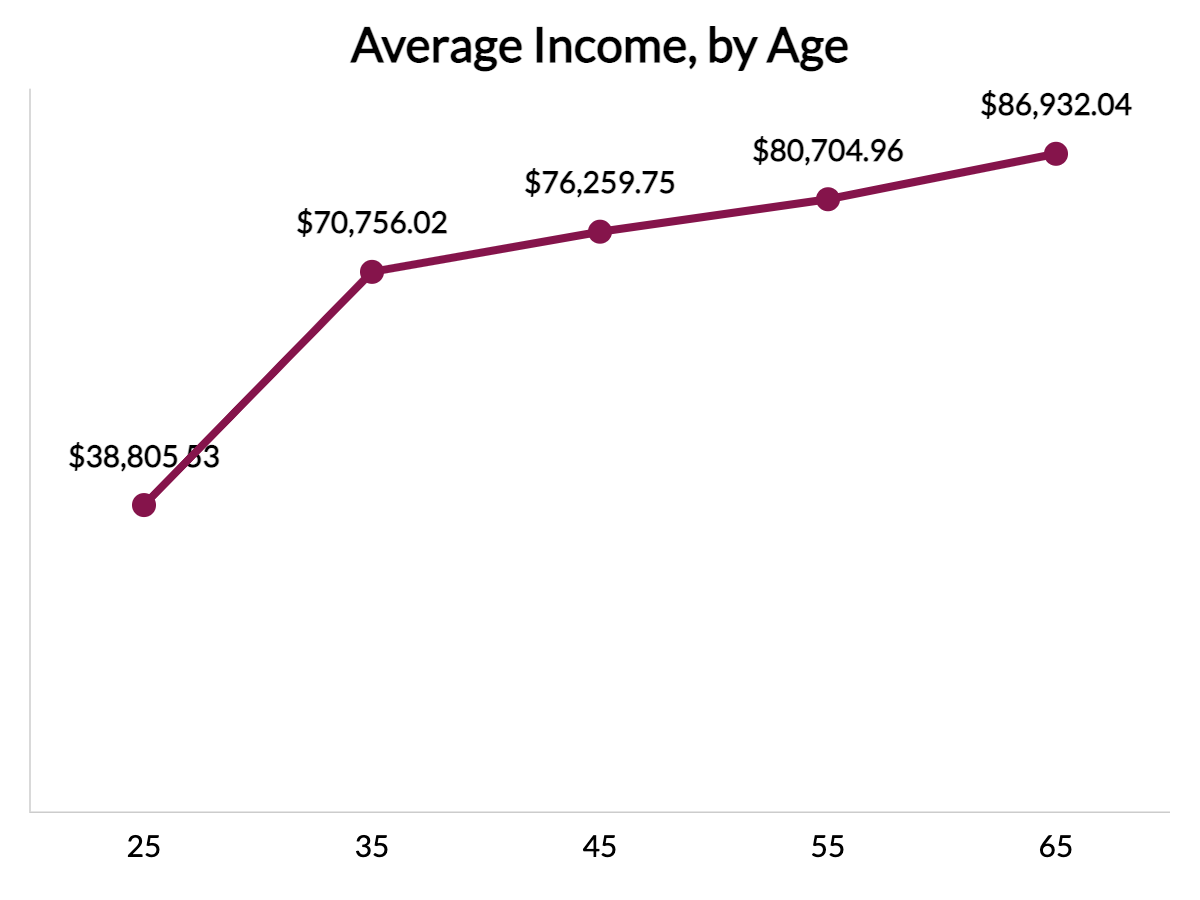
U.S. Salary Statistics By Age
In general, the older an employee is, the more they’ll earn. However, data indicate a peak for men and women between the ages of 45 and 54, followed by a slight decline after the age of 55.
| Median Weekly Earnings by Age and Sex | |||
|---|---|---|---|
| Age Group | Total | Men | Women |
| 16+ | $990 | $1,094 | $899 |
| 16 to 19 | $555 | $595 | $501 |
| 20 to 24 | $633 | $656 | $613 |
| 25 to 34 | $928 | $961 | $886 |
| 35 to 44 | $1,119 | $1,242 | $968 |
| 45 to 54 | $1,134 | $1,279 | $985 |
| 55 to 64 | $1,130 | $1,246 | $973 |
| 65+ | $989 | $1,141 | $816 |
Annually, here are the average incomes in 10-year increments:
-
Age 25: $38,805.53
-
Age 35: $70,756.02
-
Age 45: $76,259.75
-
Age 55: $80,704.96
-
Age 65: $86,932.04
To fall into the top 1% (99th percentile), workers need to earn different amounts, depending on their age. For example:
-
Age 25: $164,012
-
Age 35: $403,800
-
Age 45: $445,000
-
Age 55: $495,530
-
Age 65: $565,707 [2, 8, 9]
U.S. Salary Statistics by Education
Data indicate the higher a person’s educational attainment, the more they’ll earn. In fact, an individual with a bachelor’s degree makes more than double the average weekly wage of someone with no high school diploma.
-
By educational attainment, full-time workers age 25 and over earned the following per week:
-
No high school diploma: $620
-
High school graduates (no college): $793
-
Bachelor’s degree: $1,438
-
-
These numbers represent increases of $100, $81, $265, respectively, compared to 2017.
-
Among male college graduates with advanced degrees, the highest-earning 10% made $4,508+ per week, compared with $2,919+ for females.
| Median Annual Earnings of Full-Time, Year-Round Workers ages 25–34, by Educational Attainment and Sex: 2019 | ||
|---|---|---|
| Education Level | Men | Women |
| All | $50,000 | $43,800 |
| Less than high school completion | $29,700 | $25,300 |
| High school completion | $39,900 | $29,800 |
| Some college, no degree | $42,500 | $32,800 |
| Associate’s degree | $48,400 | $34,800 |
| Bachelor’s degree | $64,000 | $50,000 |
| Master’s or higher degree | $84,000 | $60,900 [2, 10, 11] |
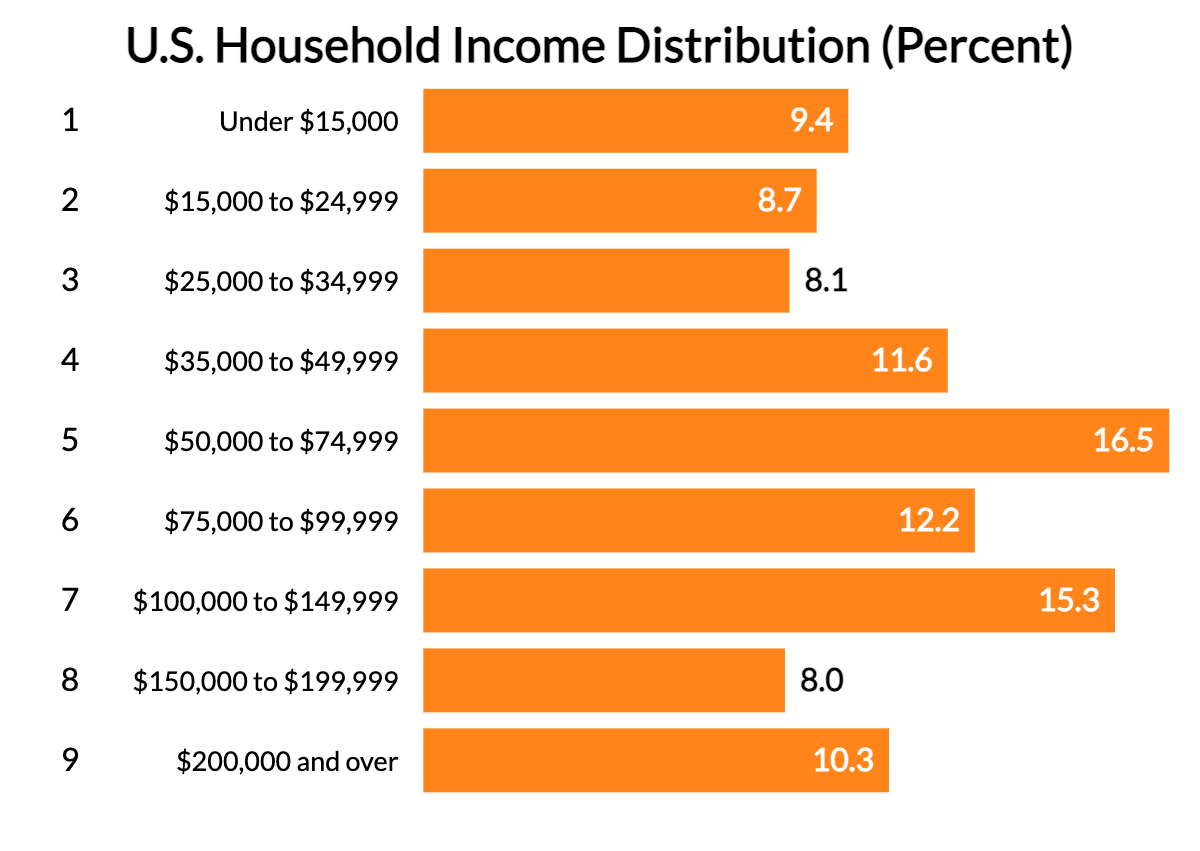
U.S. Salary Statistics by Household Income
Real median household income decreased 2.9% from $69,560 in 2019 to $67,521 in 2020. Here’s how it was distributed:
-
Under $15,000: 9.4%
-
$15,000 to $24,999: 8.7%
-
$25,000 to $34,999: 8.1%
-
$35,000 to $49,999: 11.6%
-
$50,000 to $74,999: 16.5%
-
$75,000 to $99,999: 12.2%
-
$100,000 to $149,999: 15.3%
-
$150,000 to $199,999: 8%
-
$200,000 and over: 10.3%
When it comes to all races, the real median household income is $67,521. Broken down, we find the following:
-
Black: $45,870
-
Hispanic (any race): $55,321
-
White, not Hispanic: $74,912
-
Asian: $94,903 [6, 7]
Conclusion
While it’s positive that the average U.S. worker’s salary has increased every year since 2009, there’s still a lot of progress to make when it comes to disparities based on gender and race. Furthermore, a meaningful percentage of the population (more than one in 10) lives at or below poverty levels.
FAQ
What is the average salary in the U.S.?
Based on 2021 data, the average weekly salary in the U.S. is $990, or $47,520 annually.
What’s considered middle-class income?
Middle-class income earnings range between $40,100 and $120,400 per year.
How much do you have to earn to be in the top 1%?
According to 2019 data from the Economic Policy Institute (EPI), U.S. workers have to make at least $758,434 annually to be in the top 1% of wage earners.
How much higher are U.S. men’s salaries than women’s?
According to Bureau of Labor Statistics 2020 data, men’s annual earnings were 17.7% higher than women’s.
Sources
-
U.S. Bureau of Labor Statistics. May 2020 National Occupational Employment and Wage Estimates. Accessed on 9/24/21.
-
U.S. Bureau of Labor Statistics. Usual Weekly Earnings of Wage and Salary Workers Second Quarter 2021. Accessed on 9/24/21.
-
U.S. Bureau of Labor Statistics. Highlights of women’s earnings in 2020. Accessed on 9/24/21.
-
Social Security Administration. Measures Of Central Tendency For Wage Data. Accessed on 9/24/21.
-
Organisation for Economic Co-operation and Development. Gender wage gap. Accessed on 9/24/21.
-
Statista. Percentage distribution of household income in the U.S. in 2020. Accessed on 9/24/21.
-
United States Census Bureau. Income and Poverty in the United States: 2020. Accessed on 9/24/21.
-
U.S. Bureau of Labor Statistics. Median usual weekly earnings of full-time wage and salary workers by age and sex. Accessed on 9/25/21.
-
DQYDJ. Average Income by Age plus Median, Top 1%, and All Income Percentiles. Accessed on 9/25/21.
-
U.S. Bureau of Labor Statistics. Measuring the value of education. Accessed on 9/25/21.
-
National Center for Education Statistics. Annual Earnings by Educational Attainment. Accessed on 9/25/21.
-
United States Census Bureau. Poverty Thresholds. Accessed on 9/25/21.
-
Pew Research Center. Are you in the American middle class? Accessed on 9/25/21.
-
Pew Research Center. Most Americans Say There Is Too Much Economic Inequality in the U.S., but Fewer Than Half Call It a Top Priority. Accessed on 9/25/21.
- Determine Your Worth
- Average Salaries In The US
- What Is A Salary Range?
- What Is A Base Salary?
- What Is A Pay Grade?
- Average Salary Out Of College
- Your Salary History
- Competitive Pay
- Salary Vs. Hourly Pay
- What Is A Job Classification?
- How Many Hours Can A Teen Work?
- Average Work Hours Per Week
- What Is Annual Income
- Gross Salary
- How Many Hours Is Full Time
- How Many Work Hours In A Year
- Minimum Wage For Workers Who Receive Tips
- New York State Minimum Wage Rates
- Get A Raise
- Benefits
- Paid Time Off Policy (PTO)
- Leave of Absence Policy
- What Are Floating Holidays?
- What Are Employer-Paid Holidays?
- How Does Holiday Pay Work
- How Does A Stipend Work
- Cash a Paycheck Without a Bank Account
- What Is Compensatory Time?
- What's Unlimited Vacation?
- What Is A Commission?
- What Is A Mileage Deduction?
- Semimonthly Vs Biweekly Pay Schedules
- Flexible Spending Account
- Stock Options At Job
- Benefits Package
- Overtime Pay
- Workers Comp
- What Is Fmla
- Hazard Pay
- Tuition Reimbursement
- Discretionary Vs. Non-Discretionary Bonus
- What Are Union Benefits
- What Is An HRA Account
- What Is Cobra Insurance
- Negotiation
- What Exactly Is a Job Offer?
- How To Negotiate Salary
- Exempt Employee
- How To Answer Salary Requirements
- Employment History
- What Are Your Salary?
- Salary Counter Offer
- How To Answer Salary Expectations
- How Many Hours Is Part Time
- Signing Bonus
- Cost Of Living Adjustment
- How To Ask For A Salary Advance
- What Is Fair Labor Standards Act
Author
Chris Kolmar is a co-founder of Zippia and the editor-in-chief of the Zippia career advice blog. He has hired over 50 people in his career, been hired five times, and wants to help you land your next job. His research has been featured on the New York Times, Thrillist, VOX, The Atlantic, and a host of local news. More recently, he's been quoted on USA Today, BusinessInsider, and CNBC.